The Week Ahead March 2022 – [STI, HSI, NASDAQ & S&P]
Another rollercoaster week as fighting rages on. One can only hope and wish for fighting to stop and parties to come back to the negotiation tables. As there is a cease fire going on and talks to resumes on Monday, we can pray that it will be one that is fruitful and not just to buy time and nothing good comes out of it.
Adding fuel to the fire, eyes will be on the upcoming Fed Meeting from 15-16th March regarding interest rate hike which might cause some near term volatility again.
Lastly, the annual meetings of two of China’s top political bodies has commenced this weekend. The economic and legislative decisions made at these meetings will provide a roadmap for China’s economic and social development in 2022 and are therefore of high importance to any player in the China market.
Key Events to Watch For
Markets will continue to keep tabs on the fighting and development in Ukraine while also keeping track of the impending rising interest rates.
Thursday – Initial Jobless claim, Core CPI numbers ( The Core Consumer Price Index (CPI) measures the changes in the price of goods and services, excluding food and energy. The CPI measures price change from the perspective of the consumer. It is a key way to measure changes in purchasing trends and inflation.) Take note as market might react to this too.
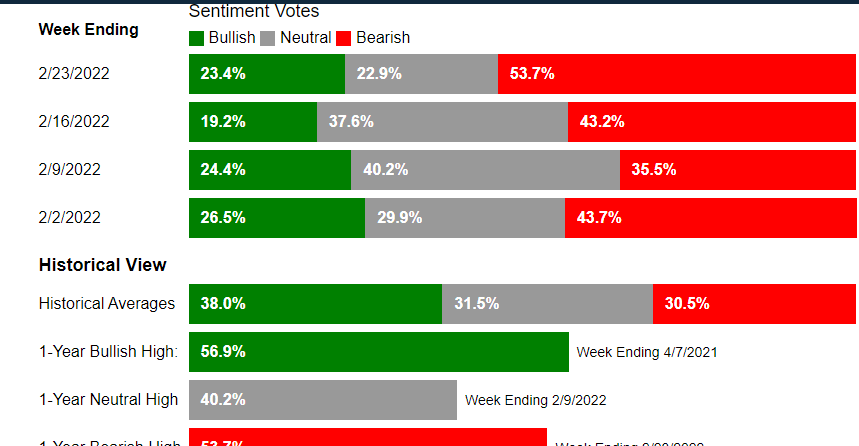
The Fear & Greed Index is at extreme FEAR now which we think is once again an opportunity to scale in rather than FLEEING. Of course remember to scale in in batches and not go in all at once. Nobody knows when the market will bottom.

Technical Levels to Watch For This Week
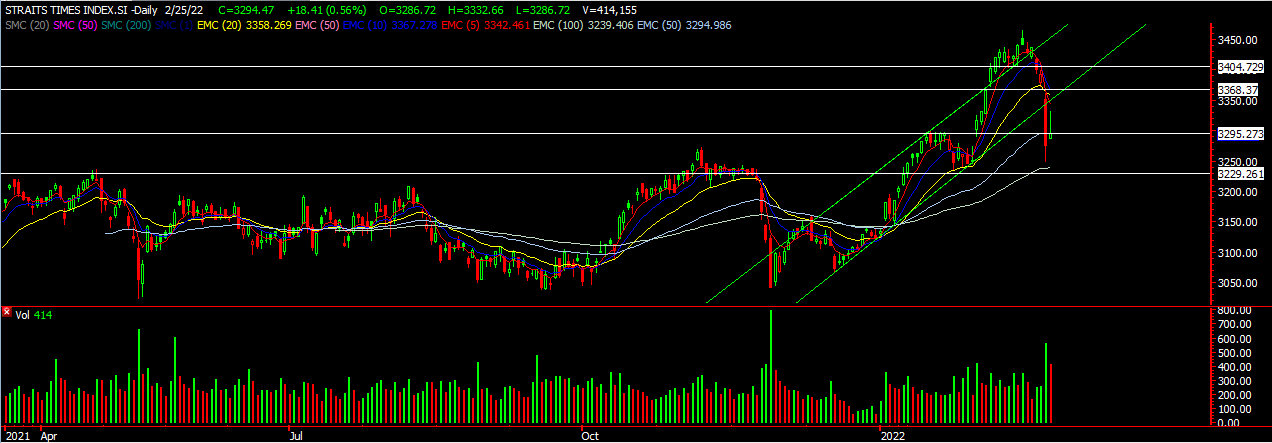
STI

Didn’t get the rebound that we were anticipating but the interesting thing was that the stocks that we have selected all produced positive gains! STI currently supported at around 3215, looking for this to hold before any rebound. BANKS are starting to looking juicy after the sell down, its on our radar now!
S&P 500

Seeing some rebound at the 4290 area with a hammer candlestick which could be positive for some rebound. S&P 500 has corrected about 14% and that 4110 remains critical. The week ahead still hinges on the war and interest rates and for traders you might want to scale back on your lot size. Market is not stable yet. Although we are looking for some upside this week, do ensure for a proper set up before entering. The near term resistance is around 4461.
Nasdaq 100
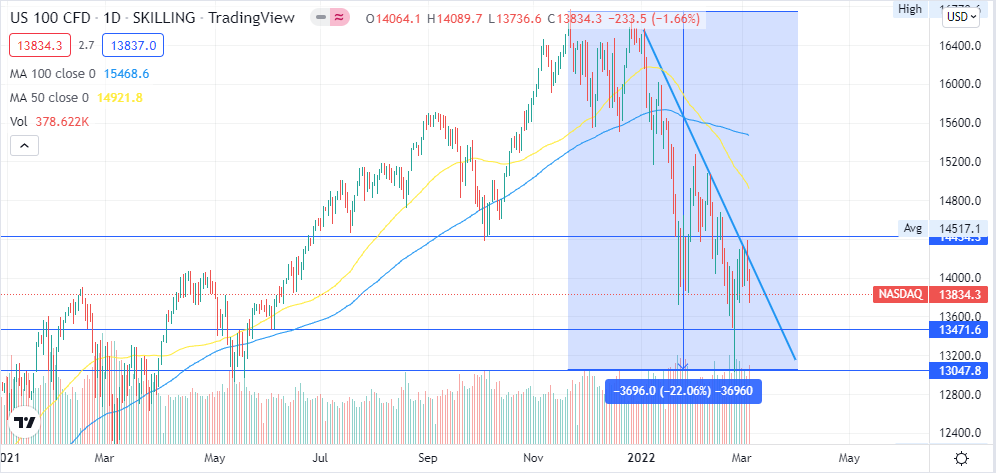
Nasdaq still not out of the woods and still facing selling pressure. We might see it move down to 13471 level first as rising interest rate might spook the tech stocks once again. Waiting for a more stable structure to form and a nice candle to form before taking further trading action.
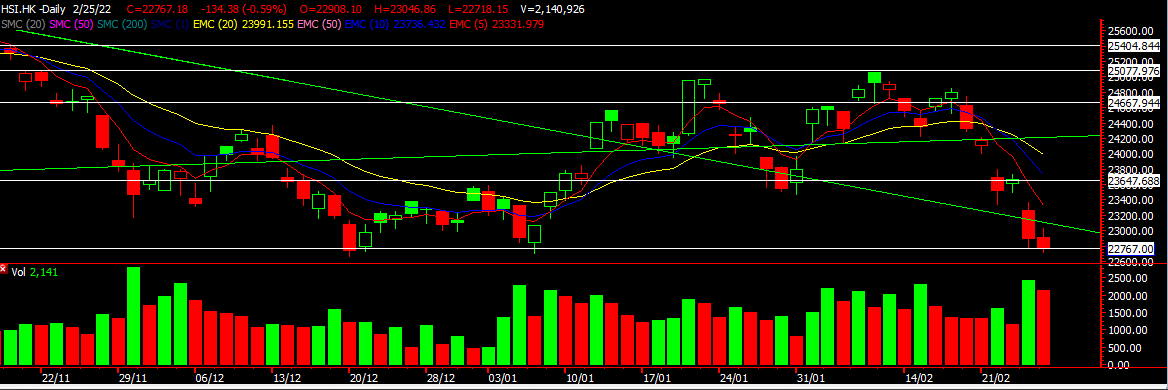
HSI
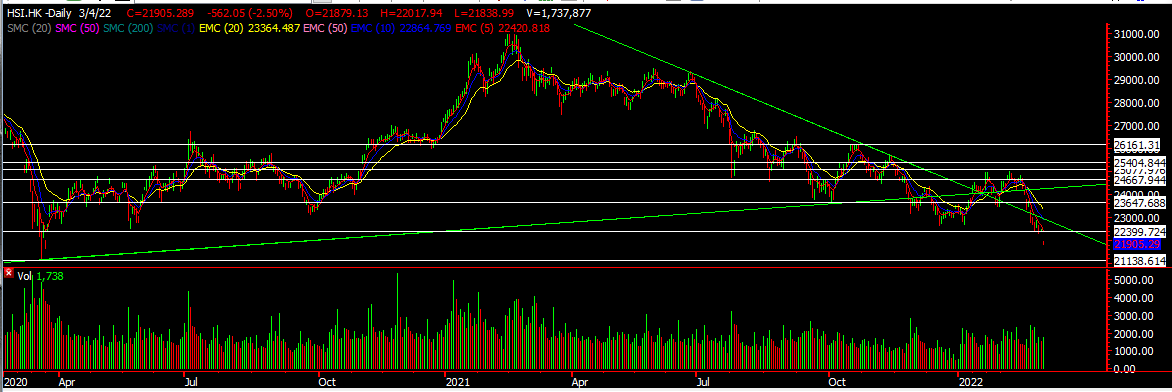
Last but not least but one of the most disappointing market for the year, is our HSI. Started well for the week but due to geo political events and more regulatory measures from China, this has really put a dampen on the HSI. We might see it move to 21138 level in the coming week and there we might see more bargain hunting come around. China’s meeting this week also sets the tone to where the HSI might be heading. Don’t give up on this fella yet!
Have a fruitful week ahead.
Yours
Humbly
Kelwin & Roy