S&P 500 – [ Crash? Stress? Distress? Let’s Confess, No One Can Predict A Crash, Our Two Cents Worth]

30th October, 2020, 7:07 AM

S&P 500 – [ Crash? Stress? Distress? Let’s Confess, No One Can Predict A Crash, Our Two Cents Worth]

Image source: kennofinanical.com

SALE SALE SALE!! haha..nah kidding! Are you worried, stress or unsure of what to do? We’ll just share our two cents worth on the current market and why this time might be a good opportunity to enter the market if you’re investing.

Market is currently jittery with a few possible reasons.

  1. Record number of Covid cases in the US, White house seems to have given up on fighting covid. Lockdowns are happening in Europe, will US also impose lockdowns?
  2. Stimulus Package. As usual, talks and talks about stimulus, delays anticipation all these adds to the volatility.
  3. ELECTIONS! It’s just round the corner! Market gets jittery around this period and volatility ensue.

As we have pointed out a few times, the weeks before election can get bumpy and even on the day itself and the day after as market reacts to the news. But from stats, we can see that regardless of who wins, market tends to go up after all the noise.

Let’s now take a look at the S&P chart to see where it might head to

S&P 500 30th Oct 2020

Chart source: poemsview 30th oct 2020

From a technical point of view, S&P is currently below the 100ema which is not a good sign but no need to panic yet. The next support would be at the 200ema at around 3200 level. Worst case scenario might be to 3132 level. Currently, S&P500 is still considered in an uptrend as the emas have yet to cross. If the 20ema cross the 50ema then the first red flag will come out. A further cross of the 100em would be our second red flag and we’ll really have to re-look at the market then.

For long term investors, this might present some opportunities for entry with a stagger system and not entering by one whole batch. We usually enter around 3-4 batches for one stock. For investing, don’t try to time the bottom as from past experience its almost impossible to do that.  If you’re a firm believe in that markets go up in the long run then you might want to take a look at the markets very soon. ( not all markets ya, be selective! ) We’re eyeing the S&P500! Have your shopping list ready! We have ours! Do you??

We’ll share more of some of the stocks we’re looking at in the next few post! Keep a look out!

Yours

Humbly

Kelwin&Roy

Gold – [ What Are The Ways To Invest In It?]

28th October, 2020, 7:05 AM

Gold – [ What Are The Ways To Invest In It?]9 of the World's Most Ridiculously Secure Safes and Vaults | Mental Floss

In Part 1 of our gold series we covered some fundamental aspect of gold and where gold prices might be heading to.

In Part 2 we’ll cover how to invest or trade in gold. How to use CFDs to gain exposure to gold and using cash to buy gold ETFs

GOLD CFDs

If you want to use CFD to trade gold these are some of the gold related products that are available on poems.

CFD allows you to long or short Gold with just 20% margin and participate in the price movement of the underlying Spot Gold directly with minimal capital and costs. Besides Spot Gold, CFD also offers other gold-related securities such as gold miners and various ETFs.

Our Thoughts : Using CFD is usually more for traders who want to take a speculative position on gold. Taking advantage of the volatility of gold being able to long or short gold.  For long term investors we would consider other ways to buy gold. So do remember your time horizon in choosing the right instrument to express your view.

GOLD MINERS ETFs

There are around 10 Gold miners ETFs with some having up to 2 times leverage.

The VanEck Vectors Gold Miners (GDX) exchange traded fund  is the most liquid vehicle for investors and traders to gain exposure to gold mining companies.GDX tracks the performance of the New York Stock Exchange (NYSE) ARCA Gold Miners Index. Its holdings include most major gold miners listed in the United States and Canada.

VanEck Vectors Junior Gold Miners ETF (GDXJ) tracks the overall performance of small-capitalized companies that are involved in gold mining.

Direxion Daily Gold Miners Bull 2X Shares (NUGT) gives you 2 times leverage on the gold miners whereas

Direxion Daily Junior Gold Miners Index Bull 2x Shares (JNUG) gives you 2 times leverage on the junior gold miners.

Do note that leveraged ETFs are not suitable for novice investors as losses will be magnified as well. Furthermore, leveraged ETFs are not meant to be held long term as the daily rebalancing will cause the value of the investment to erode over time.
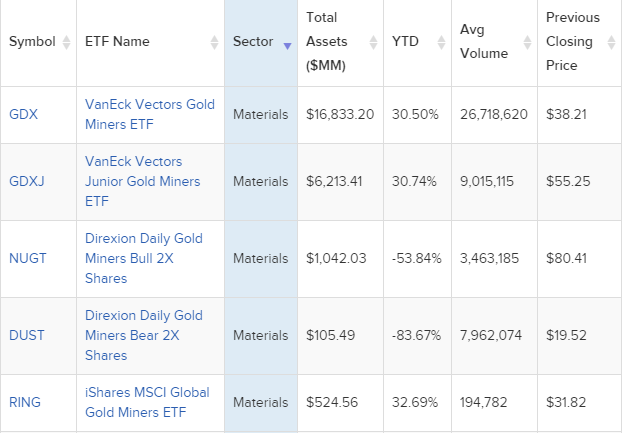
Source: etfdb.com

Our Thoughts : If you ask us we would look at the the biggest gold miner (GDX) ETF just to be safer. Gold miners are riskier to us, as investors have to be mindful of gold prices as well as the mining industry. As its lifetime performance shows, a rising gold price does not necessarily mean that GDX will also rise. When gold prices fall, it is most likely that GDX would decline. However, there might be times when GDX can deliver better returns for investors by outperforming gold price itself. We might skew towards the next category which is Gold ETFs.

GOLD ETFs

There are a variety of Gold ETFs which can be traded on the US , UK and even on the SGX!

  1. Let’s start with the largest in the world ,SPDR Gold Trust (GLD) this can be bought on the SGX or AMEX.Total assets :$77,330.10M. Expense ratio: 0.4%. Commodity exposure : physically-backed tracking gold bullion
  2. iShares Gold Trust(IAU).Total assets : $32,217.70M. Expense ratio: 0.25% .Commodity exposure : physically-backed tracking gold bullion
  3. SPDR Gold Minishares Trust (GLDM) has one of the lowest expense ratio at 0.18% but it tracks the LBMA ( London bullion Market Association)
  4. Aberdeen Stnadard Physical Gold Shares ETF (SGOL), expense ratio at 0.17 . Physically-backed tracking gold bullion
  5. ProShares Ultra Gold (UGL). This is 2 times leverage with an expense ratio at 0.95%. As you can see from the table below, the performance is almost double due to its leverage.

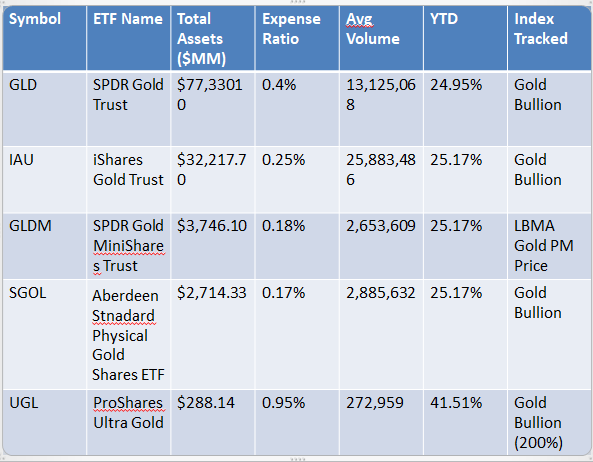
Our Thoughts: We prefer investing into the Gold ETFs as compared to Gold miners etfs or even the gold miners. One reason would be that if gold prices fall, miners usually take a bigger hit and we’re of a more conservative approach. Of course no investment if perfect, in some sense you are always forced to make compromises between risk and reward. SPDR Gold Shares, or a similar gold-owning ETF, will allow you to participate if gold rallies. The trade-off is that you’ll give up the upside potential of owning miners leveraged to the precious metal’s price.   A word of caution the average investor should avoid buying leveraged gold ETFs — these use financial derivatives and borrowed money to make bets on future price movements.

Lastly, remember to have cleared ur CAR/CKA as these are considered SIPs which require investors to have the relevant knowledge or experience to understand the risks and features of the SIPs before transacting

Do reach out to us if you would like to discuss more and we’ll be glad to walk you through this.

Yours

Humbly

Kelwin&Roy

Sembcorp Industries – [ $1.55 Target Hit! Next Target?? ]

27th October, 2020, 5:57 PM

Sembcorp Industries – [ $1.55 Target Hit! Next Target?? ]Sembcorp Industries 27th Oct 2020

Chart Source: Poemsview 27th Oct 2020

Sembcorp Industries gave us a pleasant surprise and moved up over 4.5% to hit our target of $1.55 just a day after we posted. Once again it bucked the overall trend and emerged top for the STI component.

So now that $1.55 has been hit, what’s our next target? We’re looking at $1.60 then $1.64 but of course not overnight unless Sembcorp Industries decides to surprise us! It’s good to learn how to swing your trade using CFD and not overtrade by going in and out. Learning to have a trailing stop is also important in order to ride your trade. The 10ema would be our support for now.

One suggestion might be the breakout point of $1.46 as ur trailing stop or maybe even $1.50 if u want to protect more of your profit. Remember to always take some profits off the table so you can utilize your funds too.

Want to cut through the noise and get such trade alerts straight to your handphone?

Then be our EXCLUSIVE CLIENT and find out how much value is waiting for you!

See you onboard soon!

Yours

Humbly

Kelwin&Roy


Gold – [ Let’s Talk More About It And Where It Might Be Heading Towards Part 1 ]

27th October, 2020, 7:07 AM

Gold – [ Let’s Talk More About It And Where It Might Be Heading Towards Part 1 ]

Chart Source: Poemsview 27th Oct 2020

GOLD! I’m sure most of us are not stranger to that word and have some interest in it. Gold is generally consider a safe-haven asset whenever markets are volatile and uncertain. The demand for gold is usually driven by market instability. We can see how much gold has risen ever since covid-19 hit causing one of the greatest rally in gold. Gold usually has a negative correlation to other assets like stocks and bonds but in recent times are we see US market trend up, gold has been on a steady climb. So remember to watch the charts and not just listen or read information without looking at the charts.

So are we too late into the gold rush? Let’s take a look at the charts to help us answer that. Currently gold is in a consolidation. With a lower support at around $1850 and and upper range of around $1931. Its below its 20 & 50ema of around $1907 so moving up above it is a first positive sign. It is also slightly below the short term uptrend line but regaining its foot above it at around $1914 would be another positive sign.

Biden and gold. So what will happen if Biden wins the US election? His plan for a huge stimulus might see gold prices moving up. Bigger stimulus might cause a weaker USD in the near term and has money is being pumped into the system inflation might start to creep in. Gold is usually a hedge for these events and we might even see gold retesting the high of $2000.

Next question would be how to invest in gold? We’ll cover some ways to invest in gold in our next blog post so stay tune!

Meanwhile, keeping a close watch on gold.

Yours

Humbly

Kelwin&Roy

Sembcorp Industries – [ Broke Above $1.46 Resistance, Is $1.55 Possible? ]

26th October, 2020, 7:12 PM

Sembcorp Industries – [ Broke Above $1.46 Resistance, Is $1.55 Possible? ]Sembcorp Industries 26th Oct 2020

Chart Source: Poemsview 26th Oct 2020

Sembcorp Industries once again bucked the overall downtrend today and emerged positive closing up 2%. It’s one of the rare few stocks in the STI component that managed to remain positive and hopefully we’ll see more upside.

It took a nice break consolidating for the past few and breaking out of the $1.46 horizontal resistance despite a down day. This shows strength to us furthermore, there is an increase in volume too. From our previous post, Sembcorp Industries has hit our $1.47 target and we might see $1.52 next. $1.55 might even be possible before it starts taking a break. A sustain in volume is something we’re looking out for in order for this uptrend to continue. We’ll prefer to use poems CFD in order to ride such trades as compared to contra.

Don’t forget election is just about a week plus away!

Want to cut through the noise and get such trade alerts straight to your handphone?

Then be our EXCLUSIVE CLIENT and find out how much value is waiting for you!

See you onboard soon!

Yours

Humbly

Kelwin&Roy


DBS – [ Nice Rebound From End Sept , Could The 10 Year Yield Curve Give Clues On Where It’s Heading?]

26th October, 2020, 6:55 AM

DBS – [ Nice Rebound From End Sept , Could The 10 Year Yield Curve Give Clues On Where It’s Heading?]

Chart Source: Poemsview 26th Oct 2020

DBS saw a nice rebound of about 8% since we posted near end Sept. Back then we were anticipating some rebound from our three local banks which we’re glad played out. DBS having the biggest percentage gain of all the three. It managed to breakout from our initial rebound target of $20.80 and head north towards the 200ema.

From a technical point of view the 200ema is a considered the long term resistance and is also a strong one. The last time DBS tested it was back in June but couldn’t really sustain holding above it. So now the real test is breaking above it and staying above it for about 2-3 days at least in order to see some nice upside. A rest around here would be what we would like, storing some strength for the road ahead  would be our preference. IF DBS breaks above the 200ema, our next possible target might be around $22.2o area.

Souce: https://www.treasury.gov/resource-center/data-chart-center/interest-rates/Pages/TextView.aspx?data=yield

The 10 year yield rate is seeing a steady increase for the past week, taking it a 4 months high. This bond tends to signal investor confidence too. When confidence is high, prices for the 10-year drops and yield rises. This is because investors feel they can find higher returning investments elsewhere and do not feel they need to play it safe. This is just a simple explanation on it as there are many factors surrounding it too.

Watching DBS and the other two banks closely. Are you watching them too? Let us know your thoughts on it!

We hope you managed to pick up some points on the banks when we posted last month!

Yours

Humbly

Kelwin&Roy


Why Did Medical Stocks Sell Down? And Here’s What We Did

22nd October, 2020, 6:56 AM

Why Did Medical Stocks Sell Down? And Here’s What We Did

Image source: thejarkatapost

It wasn’t a good day out for medical stocks yesterday as they all took a nosedive.

Familiar names like medtecs, UG healthcare, riverstone, Top Glove all took a beating of over 5%

What caused this sell down? One possibility could be due to this  news.  China giving 60k people with covid-19 vaccines will no ill effect.  How successful will this be? Only time will tell.

With the selling, of course we’ll be affected. We did well with UG healthcare and Riverstone but unfortunately Top Glove didn’t quite go the way we wanted it to. And here’s what we did. Sending a message to our clients to remind them that our Stop Loss in Top Glove has been hit!

No need to shy away from it, its normal to have stop loss but if you know of anyone who doesn’t CONTACT US, we want to know that person too. =) So a reminder was sent so that our  clients know it’s time to cut loss.

It is important not only to have a good section of stocks but also to have someone reminding you when it’s time to get out! As traders we all know how crucial it is to cut your losses and  not be in denial.

Want a remisier who’s looking out for you? Reminding you when it’s time to cut loss?

Contact Us to find out how you can receive such awesome service.

Yours

Humbly

Kelwin&Roy

SATS – [ Skies Are Opening Up! But Not Clear Skies Yet ]

21st October, 2020, 6:45 AM

SATS – [ Skies Are Opening Up! But Not Clear Skies Yet ]

Chart Source: Poemsview 21st Oct 2020

SATS has caught our attention since early Aug when covid cases started to stabilize and when it was trading at around $2.84. Talks were in place for travel to restart too. Singapore has been doing keep covid cases at bay with an average of 1-2 cases in the community which is  giving travelers some confidence. Phase 3 could be on the cards by year end too!

More good news as Singapore is firming up talks on travel to HK while SIA is also opening up its non-stop flight to NYC. More flights are opening up to Australia too. Cruise to nowhere is also starting next month and all these restarts are good for the badly beaten SATS. Yes, travel demand is not going through the roof yet, but countries are taking the right steps in trying to open their tourism industry.

From a technical perspective, Sats is currently above the 100ema which it hasn’t cross in awhile so this is a positive sign to us. It recently tested this support which is also the downtrend line which we drew which showed strength and could bounce back up. Immediate resistance we see is at $3.14-3.15 once that is cleared we might even it challenge the 200ema in the coming weeks.

Keeping a close watch on SATS

Yours

Humbly

Kelwin&Roy

ISDN – [ Broke Out? Can It Move Up Further? ]

20th October, 2020, 1:16 PM

ISDN – [ Broke Out? Can It Move Up Further? ]ISDN 20th oct 2020

Chart source: Poemsview 20th oct 2020

ISDN looking good as it has broken above its horizontal resistance of $0.415 with some volume.

Could it stage more upside? It tested the $0.415 resistance just a few days back but failed to break it. From a technical analysis point of view, today seems a little different as it gapped up came back down to test the support and is back up now. If it manages to stay above this resistance turn support we might see more upside.

We have drawn the support and resistance levels for ISDN, keeping a lookout! Don’t forget election is around the corner. So always have a trade plan!

Yours

Humbly

Kelwin&roy

Sembcorp Industries – [ Bucking The Overall Trend Today, More Possible Upside? ]

15th October, 2020, 5:26 PM

Sembcorp Industries – [ Bucking The Overall Trend Today, More Possible Upside? ]


Chart Source: Poemsview 15th Oct 2020

Sembcorp Industries one of the rare few counter that buck the downtrend and closed positive. In fact, it’s the highest percentage gain within the STI component for today.

We’re glad we managed to catch Sembcorp Industries just before it broke out alerting our EXCLUSIVE CLIENTS on Monday when it was trading at $1.34. A nice 10 cents upside which is about 7.5% in a week is a good trade to us! Could Sembcorp Industries continue its run? We think it might be possible given that its strong in a weak market, there is volume coming in and it closed above the $1.40 horizontal resistance.

Our next possible upside is $1.47. But do be cautious, elections is in about 3 weeks, so things could start to get volatile again.

Want to cut through the noise and get such trade alerts straight to your handphone?

Then be our EXCLUSIVE CLIENT and find out how much value is waiting for you!

See you onboard soon!

Yours

Humbly

Kelwin&Roy