The Week Ahead Aug 2023 – [STI, HSI, NASDAQ & S&P]

13th August, 2023, 11:00 PM

Some might feel a bit sad as the markets have been pulling back the last week or so with the Nasdaq pulling back about 6% and the S&P about 3.5%. As we have been mentioning for a few weeks to be prepared for a pullback especially after such a nice rally for the past few months. Many reasons can be attributed to the pullback like inflation slightly ticking up, US banks downgrade and so many more. What matter most is to make use of this pullback to continue to add to solid companies or for those who missed out on the rally to finally get in.

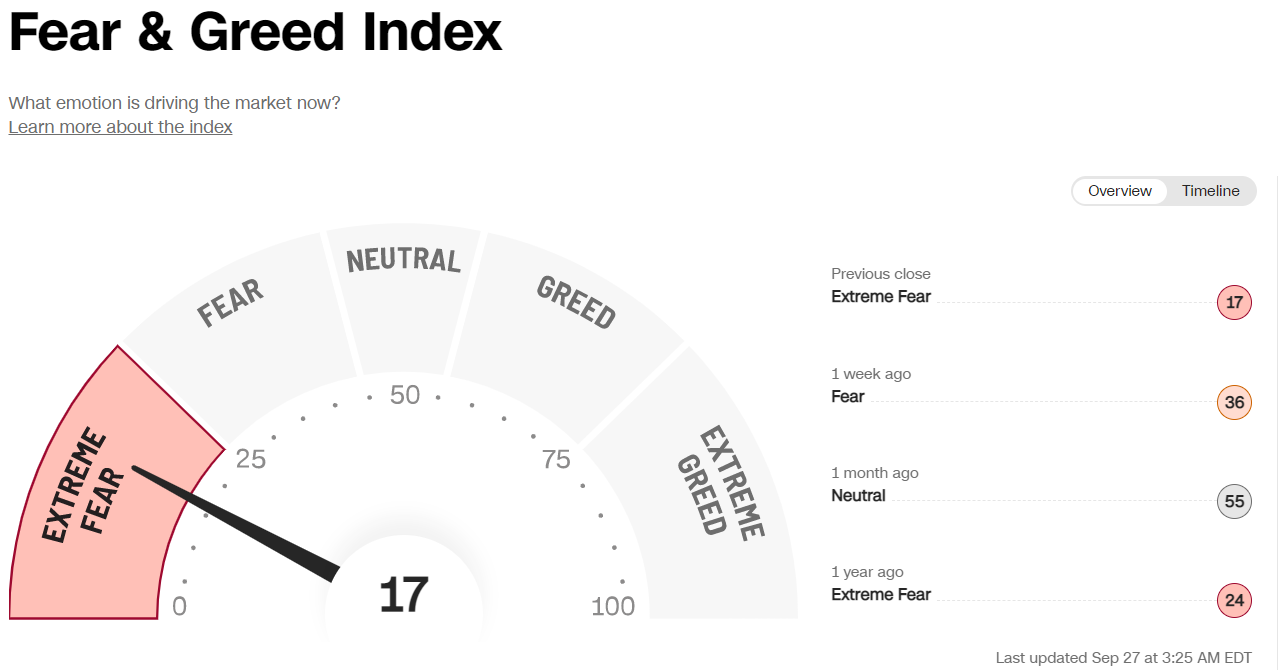
Source: Cnn greed & fear index

As cautioned back in July when the indicator was at the extreme greed area and when everyone was rushing into the market for the fear of missing the boat we patiently waited. Finally we are seeing some pullback and some bad news starting to come out of the market.

Nobody will know how much this pullback will last. But a good 10% pullback could be a chance to make an entry. Also , take a look at your individual stock as they could pullback more than the S&P like Microsoft is already down 12.5%. =)
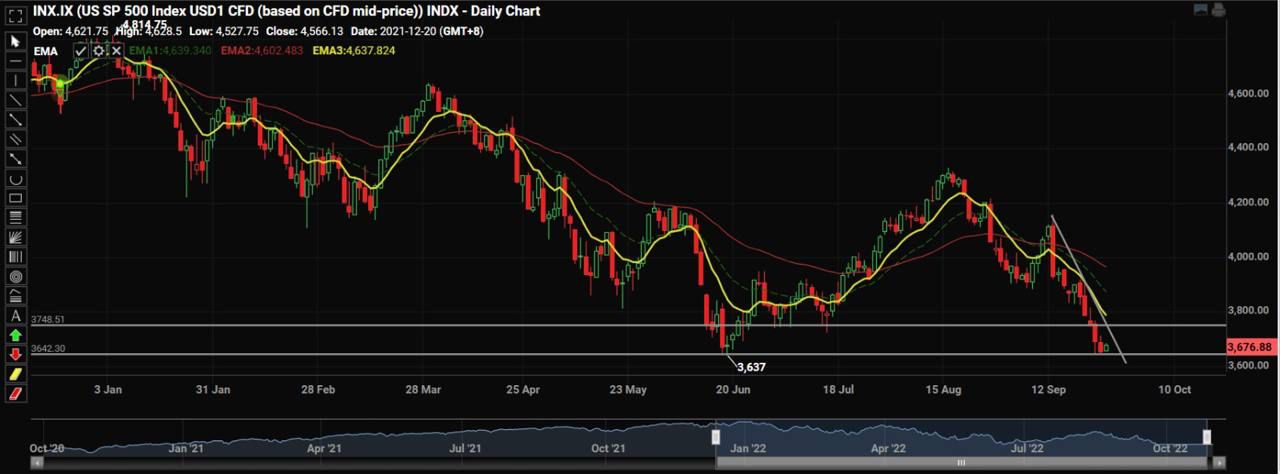
S&P 500

Source: Tradingview 13th Aug 2023

S&P500 as cautioned many times saw a nice pullback for the week. It has covered the small gap of 4463. Bad news is starting to flow out of US and for the untrained investor then this might cause some panic. The first support for the S&P500 could be at the 50ema of around 4429 level then then 4383 and even 4300 These are some levels to scale in if you’re looking for an entry.
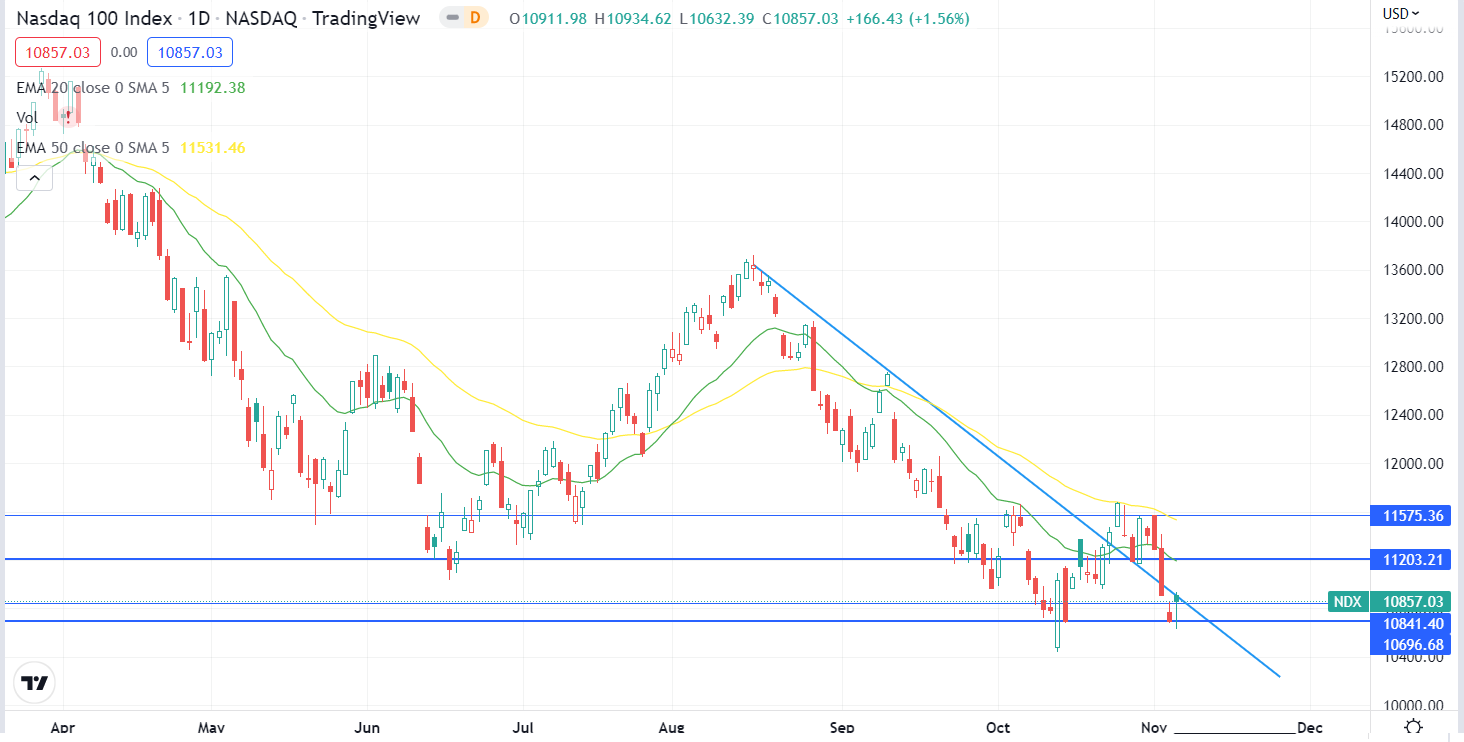
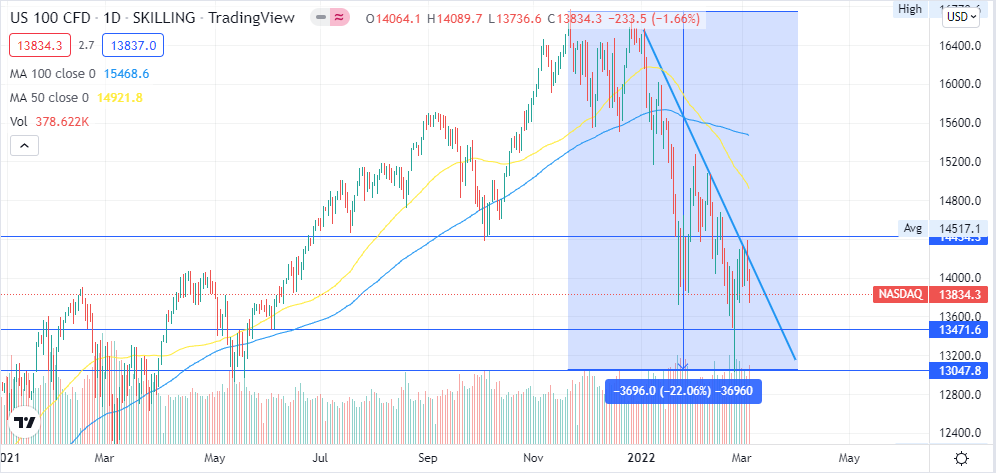
Nasdaq100

Source: Tradingview 13th Aug 2023

Nasdaq100 has pulled back more than the S&P500 because it has also risen more during the rally. Tech stocks lead the way when the recovery starts and when it pullback then its time to scale in at the support.  For Nasdaq, the first level of support is at 15000 level which we saw some rebound. This rebound could be short lived to about 15300 and then a downside support target of 14720 level might be touched. Don’t miss out on this opportunity to scale in.
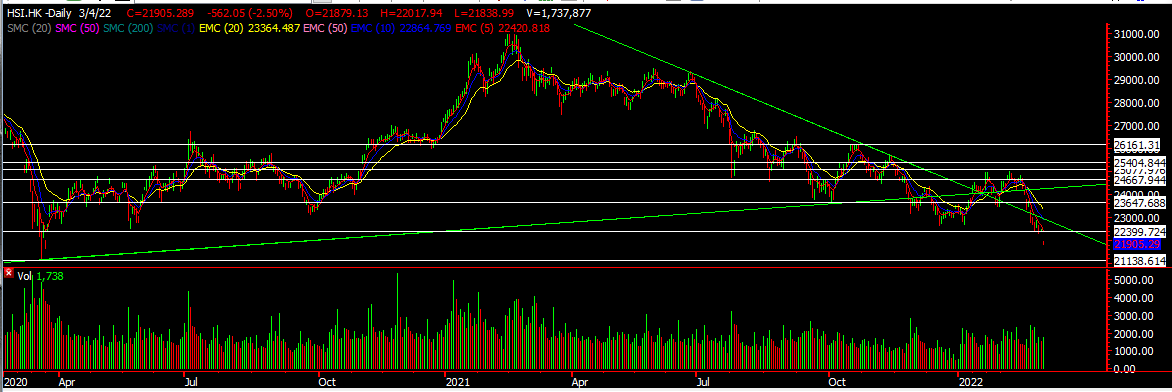
HSI

Source: DZH International Advisor 13th Aug 2023

The Hang Seng Index did not close that well for the week. A red bar with volume could see more downside for the HSI this week The next support is at 18560. This has to hold for the hang seng to resume its uptrend and not get back down to a downtrend mode. Will be watching closely for this as this could be another buying opportunity. Still a lot of negative news and deflationary concerns surrounding the China markets which is causing a stall in this rally. China needs a more conclusive policy to help boost the market sentiments and get them out of this state.

STI

Straits Times Index 13th Aug 2023

Source: DZH International Advisor 13th Aug 2023

The Straits Times Index bounced off the 20ema on Friday but we might continue to see more downside for the STI to 3240 levels. Over there then we might see a good rebound coming in. As Singapore market looks a little dull for now, set your eyes to the other markets for better returns and that is key in order to survival in such a market.

We hope you have gained some insights for the week. As usual, if you need any help in your portfolio or unsure of which stock to enter. Feel free to reach out!

Yours

Humbly

Kelwin & Roy


The Week Ahead Nov 2022 – [STI, HSI, NASDAQ & S&P]

6th November, 2022, 10:21 PM

The S&P500 ended positive for the month of Oct while also going through one of the most volatile month of the year. We are just less than 2 months to the end of the year and we hope that you all have been turning positive in your trading too. The recent rebound has helped quite a bit of your stock picking with some stocks rising over 15%!

The week was a busy one as we saw Fed raising hike but what’s more important was Fed’s forward statement and where they think interest rate will move up to. Also, on China front, we have seen a monster rally over the past week as rumors about opening up for China sparked a huge rebound. No smoke without fire?? But don’t be too carried away with this rally yet. HSI has hit our 16,350 target and retraced. Will share more in the later part.

Mid-term  elections is on 8 November which might cause some short term volatility. Read on as we share more on the markets.

S&P 500

S&P 500 6th Nov 2022

Mid-term elections on 8th Nov will probably set the tone for the US markets as focus shift to the mid-term for next week. Expecting volatility once again and an upside target of 3900 to be tested soon. S&P 500 closed at the 20ema and we are looking at it to close above that and re-test the resistance of 3900. Nov is also a seasonally higher month so fingers crossed, we might get another good month.

Nasdaq 100

Nasdaq 100 the weaker of the US indices as it has more tech companies which is more pegged to interest rates movement. It found strength on Friday night bouncing off its 10841 support and closing around the downtrend line resistance. For this week, we’re looking for a break of that downtrend line and a test of that 20ema resistance (11203). We can see that this resistance is acting as a strong resistance so far and price seems to hover around there. Once there it is advisable to take profits and then see how the markets reacts from there. The next resistance is at the 50ema at  11531.

STI

Straits Times Index 6th Nov 2022

YES! STI moved up to our target of 3124 due to the banks and a rebound of our blue chips. Stocks like Sembcorp Industries, SIA, Wilmar all lent a hand helping our index advance. For this week, global events will probably influence our STI, mid-term election and China’s news of reopening might shape our STI. For now current resistance at 3124 area, with near term target at 3160. Banks will continue to lend support but should DBS close below the 5ema our index might start pulling back.  A pullback to 3031 is healthy.

HSI

Hang Seng Index 6th Nov 2022

Saving the best for last! HAHA! HSI saw a surge of over 9% for the week with rumors about China re-opening. Traders started to pile in and shortist furiously covering shorts as the upswing in HSI was just too fierce. As the week progressed, we saw strength in HSI and issued an alert to our clients informing them of the bullishness in the index. Our second target of 16350 was hit and just nice it started to retrace. It closed at the 20ema and we got to watch this closely. As rumors about opening up caused the hang seng index to fly, a meeting on saturday quashes market rumors with China vowing to stick with the their Covid zero policy.  This could give the index a short term blow and we might see weakness coming in once again. BUT, its not the end yet as the volume for this week was significantly higher and we would be observing very closely how the market reacts to this before determining our next move! So stay tune. Bargain hunters stay alert!

Feel Free to drop us a message if you want to know more.

Yours

Humbly

Kelwin& Roy


Fear Is At Its All Time High, BUT What Is Market Doing?

27th September, 2022, 4:33 PM

Image credit : https://edition.cnn.com/markets/fear-and-greed

Image credit: https://www.aaii.com/sentimentsurvey

Currency market is going nuts, pound making new low against USD, Jap yen is also at a an all time low while the USD index is strengthening. This together with Fed relentless effort to rein in inflation has caused markets to tumble and fall hard. With fear and volatility at its highest, one would expect even more selling in the market. BUT something we notice that is catching our attention. US markets are actually holding up.

Everyone is eyeing for markets to break June low and maybe a possible fake break before a rebound comes. But for the last two nights, markets has actually been able to hold its support of around 3641, very very close to the June low. With such brutal  sell down over the last week we might actually see some rebound coming in. Indicators are currently oversold and yes oversold can remain oversold for an extended period but at least we know we’re not at the top and we might be scraping the bottom. A positive sign is that the rebound is happening at the Friday’s low where is actually tried to rebound from.

We’re watching to see if this support can hold for another session or two and one more thing to look for is the momentum. If market is met with selling, we would see selling with intensity and that’s one sign to see that market is not ready for a rebound.  Another note to remember,  Oct will also kick start earnings. It may or may not bring cheer to the markets.

What’s your take? How are you positioning yourself?

Yours

Humbly

Kelwin & Roy

The Week Ahead March 2022 – [STI, HSI, NASDAQ & S&P]

6th March, 2022, 4:46 PM

The Week Ahead March 2022 – [STI, HSI, NASDAQ & S&P]

Another rollercoaster week as fighting rages on. One can only hope and wish for fighting to stop and parties to come back to the negotiation tables. As there is a cease fire going on and talks to resumes on Monday, we can pray that it will be one that is fruitful and not just to buy time and nothing good comes out of it.

Adding fuel to the fire, eyes will be on the upcoming Fed Meeting from 15-16th March regarding interest rate hike which might cause some near term volatility again.

Lastly, the annual meetings of two of China’s top political bodies has commenced this weekend. The economic and legislative decisions made at these meetings will provide a roadmap for China’s economic and social development in 2022 and are therefore of high importance to any player in the China market.

Key Events to Watch For 

Markets will continue to keep tabs on the fighting and development in Ukraine while also keeping track of the impending rising interest rates.

Thursday – Initial Jobless claim, Core CPI numbers ( The Core Consumer Price Index (CPI) measures the changes in the price of goods and services, excluding food and energy. The CPI measures price change from the perspective of the consumer. It is a key way to measure changes in purchasing trends and inflation.) Take note as market might react to this too.

The Fear & Greed Index is at extreme FEAR now which we think is once again an opportunity to scale in rather than FLEEING. Of course remember to scale in in batches and not go in all at once. Nobody knows when the market will bottom.

Technical Levels to Watch For This Week

STI

Didn’t get the rebound that we were anticipating but the interesting thing was that the stocks that we have selected all produced positive gains! STI currently supported at around 3215, looking for this to hold before any rebound. BANKS are starting to looking juicy after the sell down, its on our radar now!

S&P 500

Seeing some rebound at the 4290 area with a hammer candlestick which could be positive for some rebound. S&P 500 has corrected about 14% and that 4110 remains critical. The week ahead still hinges on the war and interest rates and for traders you might want to scale back on your lot size. Market is not stable yet. Although we are looking for some upside this week, do ensure for a proper set up before entering. The near term resistance is around 4461.

Nasdaq 100 

Nasdaq still not out of the woods and still facing selling pressure. We might see it move down to 13471 level first as rising interest rate might spook the tech stocks once again. Waiting for a more stable structure to form and a nice candle to form before taking further trading action.

HSI 

Last but not least but one of the most disappointing market for the year, is our HSI. Started well for the week but due to geo political events and more regulatory measures from China, this has really put a dampen on the HSI. We might see it move to 21138 level in the coming week and there we might see more bargain hunting come around. China’s meeting this week also sets the tone to where the HSI might be heading. Don’t give up on this fella yet!

Have a fruitful week ahead.

Yours

Humbly

Kelwin & Roy

The Week Ahead Feb 2022 – [STI, HSI, NASDAQ & S&P]

20th February, 2022, 4:45 PM

The Week Ahead Feb 2022 – [STI, HSI, NASDAQ & S&P]

Another volatile week for the US as Ukraine-Russia tension grew and markets pulled back on fear of war breaking out over there.  China continues to push new regulations with the latest on Friday  issuing guidance for online food delivery platforms to reduce service fees to help to lower operating costs for catering businesses.  This sent Meituan (3690.HK) down 15% . Singapore once again fair better than the West BUT it might be time to take a break from the weeks of gains. As we enter a new week, tensions of war along side with rising inflation will continue to haunt the markets. S&P 500 has also closed below its 200 days moving average, are we expecting more downside? Read on to find out more.

Key Events to Watch For 

Tuesday – CB Consumer Confidence (Consumer Confidence measures the level of consumer confidence in economic activity. It is a leading indicator as it can predict consumer spending, which plays a major role in overall economic activity. Higher readings point to higher consumer optimism.)

Thursday – US GDP Q4, Gross Domestic Product (GDP) measures the annualized change in the inflation-adjusted value of all goods and services produced by the economy. It is the broadest measure of economic activity and the primary indicator of the economy’s health.

Initial Jobless Claims, Crude Oil Inventories

Friday – Core Durable Goods Order (Core Durable Goods Orders measures the change in the total value of new orders for long lasting manufactured goods, excluding transportation items. Because aircraft orders are very volatile, the core number gives a better gauge of ordering trends. A higher reading indicates increased manufacturing activity.)

Technical Levels to Watch For This Week

STI

As mentioned last week, its good for STI to have some pullback so that traders and investors can move in. A spinning top pattern like candlestick formed on Thursday and with Friday’s candle closing lower, we might see more downside this week. Some support levels we’re looking at, 3400 then 3368 first. Banks continue to hold the index up, although we have seen pockets of Blue Chip stocks moving up especially the recovery play ones like SATS, Comfort, SIA Eng and even Thaibev. We’re continuing to focus on these recovery stocks.

HSI 

Just as HSI was gaining some grounds, but China  has decided to enforce more regulations regarding online delivery to reduce their service fees to spur greater economic growth. That sent the HK markets into a dive sparking another round of sell off as investors worry of more regulatory crack down. Tencent, Alibaba, JD all took a hit and we’ll wait for a base to form once again to look for entry. HSI might see more downside to about 23647 before finding some support

S&P 500

The S&P 500 has closed below its 200 days moving average for 2 days straight. Its not a good sign and has to regain above this in the next 2-3 trading days if not be prepared for more downside. Overall, if S&P 500 tests the previous low, we’re only at about 12%  correction which is still possible for a further downside to even 15-18%. So hang on tight as markets grapple with the ever changing tune of Russia- Ukraine tension. Bracing for more downside. to 4290 first.

Nasdaq 100 

Nasdaq also is below the 200 moving average for the past week and is structurally weak which signals more downside. Tech stocks continue to struggle with ongoing concerns of more rate hike throughout the year. A pullback to 13448 wouldn’t be surprising as that would represent about 20% price correction.

Hang in tight if you’re invested into fundamentally good stocks with wide economic moat.

For traders, do stick to your stop loss and be disciplined especially during such times. Hedging is also a strategy to adopt for this year as we uncover the benefits and reasons for this strategy last week.

Have a fruitful week ahead.

Yours

Humbly

Kelwin & Roy


Tesla – [ Good News! Joining The S&P500! What’s Next?]

17th November, 2020, 5:34 PM

Tesla – [ Good News! Joining The S&P500! What’s Next?]

Image Source: arstechinica.com

Tesla 17th Nov 2020

Chart Source: Tradingview.com

Tesla surged over 10% when it was announced that its finally added to the S&P500 effective 21 Dec 2020 (Monday). Inclusion is based on qualitative and quantitative analysis and being included gives a mark of confidence to investors. There is over USD 11.2 trillion in assets benchmarked to the S&P500 and roughly USD 4.6 trillion of this total is in index funds.  The index includes 500 leading companies and an inclusion in this index brings more funds and investors to the company. So with an inclusion, it’ll probably receive more attention as pension funds, 401K and funds over the world start to add tesla to their portfolio.

To be included inside the index, a company needs to have an accumulation of 4 consecutive quarters of net profits. Tesla had 5 and in the third quarter delivered a record number of 140k cars and is on track to deliver 500k cars this year. In fact, in sept it wasn’t included and its price started to fall and touched the 50ema. With a market cap of 400b and overtaking even Visa it was probably a matter of time before its included.

So with the news of the inclusion , what might we expect? The resistance for Tesla is around $458 and being able to close above it then we might see a push towards $500. It has also recently reached the 50ema which we mentioned in our post. Traders, investors might start piling into tesla when it opens tonight and optimism might be growing as now it seems that tesla is less risky of a stock. As mentioned in our previous post on tesla, with biden’s push for green energy, tesla could also benefit from it. Also, tesla is a tough stock to trade and we prefer to be invested in it rather than taking the spikes in volatility.

Want to know how to trade the US markets?

Contact Us now

Yours

Humbly

Kelwin&roy


S&P 500 – [ Crash? Stress? Distress? Let’s Confess, No One Can Predict A Crash, Our Two Cents Worth]

30th October, 2020, 7:07 AM

S&P 500 – [ Crash? Stress? Distress? Let’s Confess, No One Can Predict A Crash, Our Two Cents Worth]

Image source: kennofinanical.com

SALE SALE SALE!! haha..nah kidding! Are you worried, stress or unsure of what to do? We’ll just share our two cents worth on the current market and why this time might be a good opportunity to enter the market if you’re investing.

Market is currently jittery with a few possible reasons.

  1. Record number of Covid cases in the US, White house seems to have given up on fighting covid. Lockdowns are happening in Europe, will US also impose lockdowns?
  2. Stimulus Package. As usual, talks and talks about stimulus, delays anticipation all these adds to the volatility.
  3. ELECTIONS! It’s just round the corner! Market gets jittery around this period and volatility ensue.

As we have pointed out a few times, the weeks before election can get bumpy and even on the day itself and the day after as market reacts to the news. But from stats, we can see that regardless of who wins, market tends to go up after all the noise.

Let’s now take a look at the S&P chart to see where it might head to

S&P 500 30th Oct 2020

Chart source: poemsview 30th oct 2020

From a technical point of view, S&P is currently below the 100ema which is not a good sign but no need to panic yet. The next support would be at the 200ema at around 3200 level. Worst case scenario might be to 3132 level. Currently, S&P500 is still considered in an uptrend as the emas have yet to cross. If the 20ema cross the 50ema then the first red flag will come out. A further cross of the 100em would be our second red flag and we’ll really have to re-look at the market then.

For long term investors, this might present some opportunities for entry with a stagger system and not entering by one whole batch. We usually enter around 3-4 batches for one stock. For investing, don’t try to time the bottom as from past experience its almost impossible to do that.  If you’re a firm believe in that markets go up in the long run then you might want to take a look at the markets very soon. ( not all markets ya, be selective! ) We’re eyeing the S&P500! Have your shopping list ready! We have ours! Do you??

We’ll share more of some of the stocks we’re looking at in the next few post! Keep a look out!

Yours

Humbly

Kelwin&Roy

S&P 500 – [ Don’t Fight The Fed! ]

4th June, 2020, 5:55 PM

S&P 500 – [ Don’t Fight The Fed! ]S&P 500 4th june 2020

Chart Source: Poems2.0 4th June 2020

Many are still in disbelief as S&P 500 rose over the couple of weeks. From our previous post just two weeks back, we mentioned to stay alert as it was in a consolidation and could breakout either way. S&P 500 chose the upside so as a trader, being flexible is key. It broke out and touched our target of around 3111 and a little bit more before having a small pullback.

So what now?  As the S&P500 has been supported by the 5 and 10 ema unless it closes above we’ll have to follow the trend. Around 3130 area is the resistance for now so some pullback might be expected. You can view the chart on our Poems2.0 platform for reference.

In closing, as the word out in the street goes, DON’T FIGHT THE FED! It also means don’t fight the trend, follow the trend as the trend is your friend. =)

We hope our trading blog has shed some light on the market and our readers have learnt something from our sharing.

Yours

Humbly

Kelwin&roy


S&P 500 – [ Sideways Consolidation, Stay Alert! ]

19th May, 2020, 7:31 PM

S&P 500 – [ Sideways Consolidation, Stay Alert! ]S&P 500 19th May 2020

Chart Source : Poems2.0

It was a very strong finish over in the USA as stocks surge on positive news of a vaccine by moderna. 

That surge took the S&P past its 200ema on its daily chart which is a positive sign if you’re on the long side. On the daily chart we can see its on a bigger sideways consolidation from about 2760 to around 2968 levels.

If S&P 500 does break above the 2968 level we might see it move to the next possible level of  3100. Many have been skeptical of the rally so far and to be fair we have been too. S&P 500 have rebound about 30%  since the low and is just about 13% off from the high. Its quite hard to imagine that given all the bad economic data that has been coming out. With unemployment data at its all time high, people calling this worse than the great depression. But one thing that  other traders are mentioning is ‘don’t fight the feds’ . They have been quick to respond to the crisis, printing and pumping trillions into the markets.

Though we have caught some downside, we would have wished for a lot more but if market at this point in time is not going down, let’s follow the trend and see where that takes us to. It could be a false breakout at this level so stay alert! Don’t give up yet!

If you like to have a discussion on the markets feel free to drop us a line. 

Yours

Humbly

Kelwin&roy

S&P 500 – [What Now After Hitting Our Resistance]

4th May, 2020, 8:05 AM

S&P 500 – [What Now After Hitting Our Resistance]

S&P 500

Chart Source: Poems2.0 3rd May 2020

It was a week where the bulls were seemingly in control and a string of good news with some not so bad earnings coming out from the big tech companies. But towards the end of the week, the S&P started to have some profit taking.

From our previous blog regarding the S&P 500, it has  actually gone up to the weekly 50ema which we highlighted, the area where we will turn cautious and will be looking out for short opportunities. As the S&P 500 roared through the weekly 50ema, traders were turning bullish and started piling up their longs thinking that market will continue to trend higher. Sadly, S&P 500 made an intra day high of 2972 and started to fall back down.

We are continuing to look for short opportunities and S&P 500 might fall to about 2725 area first in the coming days – weeks and breaking that support might see more downside.

We will update more as time comes. Hope you learnt something from our post and if you’re interested in learning how to use Poems CFD to short the market, do drop us a message.

A trader who only knows how to go long and now short has lost half the battle already! So picking up a new skill during this period is critical!

We also shared a video analysis on the S&P 500 previously, so do head over to our facebook page to check it out!

Yours

Humbly

Kelwin&Roy