Best World – In It’s Own World?

31st July, 2017, 11:14 PM

Best World – In It’s Own World?BW

Best World, currently sitting on the uptrend line that we drew.  It had a flushed last Friday to the uptrend support line and rebound from there. Even with market going up and down best world seems to be well supported

If Best World can clear 1.55 we might see it test the high of 1.60 again. Its results will be out on 7th Aug (Next Monday) after market. Recently counters like china aviation , china sunsine were some stocks that had heavy profit taking after their results were released. So do take note of the risk going closer into results day.

Our stop loss would be 1.47

Yours

Humbly

Kelwin&Roy


Oxley- 4th Time Testing

24th July, 2017, 11:57 PM

Oxley- 4th Time Testingoxley

After a very good run for KSH we’re now looking at Oxley.

Oxley  is testing our downtrend line which we drawn for the fourth time. If it breaks out we might see it move higher to 0.61. We’ll be watching to see if that line can break if not it might retrace back to our lower channel support line.

The breakout point changes everyday so if you want a ‘live’ update simply Contact Us and we’ll guide you through the trading day.

Yours

Humbly

Kelwin&Roy

STI- [ No Action Taken Yet]

18th July, 2017, 12:09 AM

STI- [ No Action Taken Yet]sTI

Our Straits Times Index or STI had a huge run on Friday partly due to the huge gap up for GLP which enabled it to break through the consolidation it had  for the last 2 months. It broke the horizontal support and could now be aiming for 3300 then 3350.

Admittedly there was no chance for any shorts as STI just burst up but of course we managed to look for other counters to ride the upside.

STI didn’t follow our plan so we’re saved this round. Remember its always important to have a trade plan. We’ll share more this coming Wednesday on how important is it to have a proper road map and trade plan in order to trade well.

Click HERE to register for our upcoming workshop.

Yours

Humbly

Kelwin&Roy

KSH- [ Yet Another Target Met, A Beautiful Trade]

17th July, 2017, 12:27 AM

KSH- [ Yet Another Target Met, A Beautiful Trade]KSH

KSH reached our third target of $1 as previously blogged and even went to $1.01. A beautiful trade of about 8% upside for the week and we hope that you learnt something useful from it. How volume and resistance works.

Our next target might be around $1.04-1.05 and we’ll shift our trailing stop up now to either 0.975 or $1. *Hint* Watching the closing is crucial.

We’ll be sharing more this coming Wednesday on our strategies which we have shown and much more. Do click HERE to register for it.

Yours

Humbly

Kelwin&Roy

KSH – [Spotted Before the Gap Up Today, Closing In To Our Second Target]

13th July, 2017, 11:51 PM

KSH – [Spotted Before the Gap Up Today, Closing In To Our Second Target]KSH

KSH had a nice gap up today just two days after we blogged about it. It gaped above the 20 days moving average and also our horizontal resistance line of 0.93.  A nice upside then followed which hit our first target of 0.955 and closed above it.

We will put a trailing stop now at 0.93 so the worse case scenario is losing 0.05 cents. But of course we will be watching the market during the day to see if we need to take profit along the way. Remember flexibility is important too.

Our next target would be 0.975 then 0.995-1 as this might be a psychological level and there would be some resistance here.

We’ll be conducting a simple workshop next Wednesday, where we’ll be sharing our simple techniques on how we spot such stocks. Also how we can use CFDs to swing trade such stocks to maximize our returns. Simply click here to register now.

Yours

Humbly

Kelwin&Roy

Trading success: Identify Stocks with a winning edge (Registration link attached)

13th July, 2017, 8:18 AM

Free Trading Seminar

Hi Friends

Do you feel exasperated, confused or experience difficulty in trading stocks with the recent swings in markets?

Are you struggling to navigate this market alone with no guidance from anyone ?

Would you like to receive FREE education? And receive timely market updates and stock analysis from remisiers you can rely on ?

If you reply yes to the above questions – Fret Not , We are here to HELP and assist YOU. Do not worry and Rest assured that this is not another workshop selling courses.

We would like to invite you to our sharing session which is absolutely FREE. Here’s a look at what you can be expecting:

  • Sharing some simple yet effective strategies to identify stocks with good risk reward and how to trade with prudent risk management.
  • Sharing on how we can provide FREE and consistent education, guided by us (Phillips Team of Top Trading Representatives Kelwin & Roy)
  • How to join our community and benefits of being our clients and receiving the quality services we provide in our community like useful and timely stock analysis via WhatsApp in future.
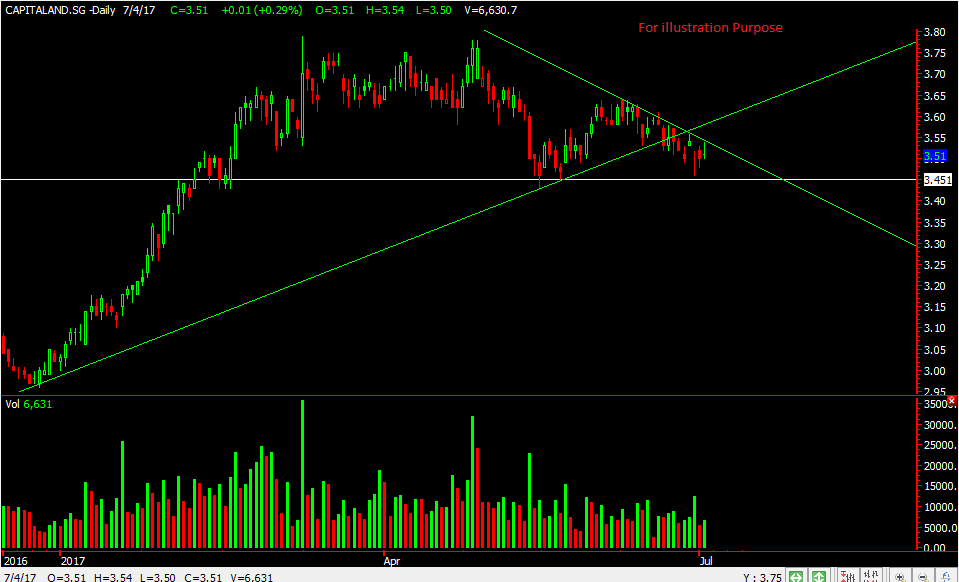
  • Sharing on Other technical stock trading fundamentals with specific stock analysis and examples:
    1. How to identify Potential Entry, Stop Loss and Target Profit Zone on Long and Short Positions.
    2. How to Short Sell Stocks using CFDs so that you will be prepared for the next market pullback like our blog post on Wilmar

Again, This Session is absolutely FREE. We don’t believe in piling up unnecessary course fees and would like to have a casual sharing on some analysis and to have a personal touch point with you, our readers.

You are certainly more than welcome to come with a friend who can also benefit from this. Do NOT give this opportunity a miss!

Please register in the link below for the event :

https://www.eventbrite.sg/e/trading-success-identify-stocks-with-a-winning-edge-tickets-35350952651

Yours

Humbly

Kelwin&Roy

Straits Times Index – At A Pivotal Point

13th July, 2017, 12:24 AM

Straits Times Index – At A Pivotal PointsTI

We’ve been asked by many on our views on the straits times index or STI for short and thought we’ll just do a short sharing over here.

From our chart the immediate support of STI would be around 3200. Many eyes are on it and the moment it stays below that, it might attract  shortist to come in.

STI has been ranging between 3258 region and 3200 for the last 2 months with no real direction. So if a break were to occur this might set the tone for a pullback. The 20 days MA is sloping down and have cut the 50ma too which in a technical term means the direction might be down. This hasn’t occurred since late last year. Dow, Nasdaq all have been making new high but our Straits Times Index hasn’t seem to make any new high.

With each rebound STI can’t seem to break out too. So lets watch to see which levels play out. We got our next few levels of support drawn. And would be ready in the case if STI starts to fall. The 200ma would be our final support. The banks which have largely been supporting the STI also seems to be pulling back.

We’ll be using Poems CFD and did you know that poems is the only stockbroker in Singapore that offers the Straits Times Index for trading? =)

If you want to learn more about Poems CFD and how you can be trading the STI both long and short. Just click HERE as we’ll be having a seminar next Wednesday show casing our CFD and some of our strategies.  Hope to see you there.

Yours

Humbly

Kelwin&Roy


KSH – A Rise in Volume

10th July, 2017, 11:20 AM

KSH – A Rise in VolumeKSH

KSH a well established construction and property development has seen some increased in volume in the morning. Its close to mid day and the volume looks rather healthy. Hence it has caught our attention.

The resistance for KSH is at 0.93 and a break above that might see it move towards our two potential resistance at 0.955 then 0.975. A good breakout would be for it to hold above 0.93.

Our stop loss would be at 0.885.

Yours

Humbly

Kelwin&Roy

Capitaland – Where To Now?

5th July, 2017, 12:55 AM

Capitaland – Where To Now? capitaland

Capitaland a property stock has been testing the short term downtrend that we drew a few times and can’t seem to break out from it yet.

If it fails to break we might see it head down towards 3.45 and if that horizontal support breaks then we might eventually see 3.39.

If it breaks above the downtrend line then Capitaland might face a few hurdle to cross . One of which is the  50 days moving average and the other uptrend line we drew.  So a stop loss above 3.58 can be placed.

Yours

Humbly

Kelwin&Roy