The Week Ahead Feb 2022 – [STI, HSI, NASDAQ & S&P]

27th February, 2022, 4:34 PM

The Week Ahead Feb 2022 – [STI, HSI, NASDAQ & S&P]

Fighting has erupted over in Ukraine as Russia forces begin its invasion! Its something not totally unimaginable but something we all really want to avoid. Unfortunately Putin has given the green light and lives had been lost over the week. Hoping for a quick resolution to this and for both countries to go back to the negotiation table.

News of fighting has definitely sent the markets into a sharp sell off, a move also not surprising. For INVESTORS who sold, they might have found themselves in a bit of a tight spot as market rebound eliminating the downside even for the week! As we continue to remind our clients the importance of remaining calm and investing into fundamentally good stocks lets look ahead to see what the week ahead might bring for us.

Key Events to Watch For 

Markets will continue to watch for new developments on the fighting front and will turn its eyes back onto data when the situation has stabilize.

Wednesday – ADP Nonfarm Employment Change (The ADP National Employment Report is a measure of the monthly change in non-farm, private employment, based on the payroll data of approximately 400,000 U.S. business clients. The release, two days ahead of government data, is a good predictor of the government’s non-farm payroll report. The change in this indicator can be very volatile.)

Thursday – Fed Chair Powells Testify (Federal Reserve Chair Jerome Powell  is to testify on the economic outlook and recent monetary policy actions before the Joint Economic Committee, in Washington DC. The testimony is in two parts; the first is a prepared statement, then the committee conducts a question and answer session. The Q&A portion of the testimony can see heavy market volatility for the duration.

 Friday – Nonfarm payroll, Unemployment rate
Taking note of the Fear & Greed Index and the AAII Sentiment index.
Source: https://money.cnn.com/data/fear-and-greed/

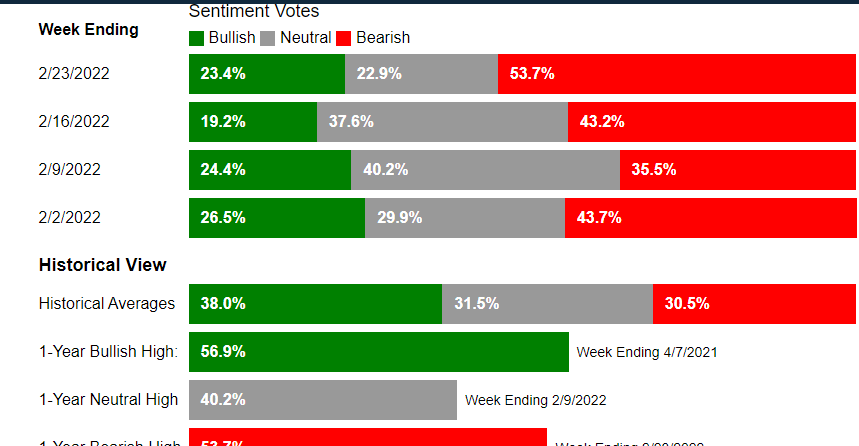
Source: https://www.aaii.com/sentimentsurvey

These are some indicators to gauge the market sentiments and as we can see, market is getting more bearish and with the recent events that is happening, more bearish sentiments are around. As we have mentioned previously, S&P500 correcting about 15% is not unexpected and INVESTORS might have to take the chance to pick up quality stocks. Whenever market is at extreme fear, that’s when we should take advantage of it and not buy into the FEAR. Of course this will take studies and analysis and conviction.

For traders, ensure you have proper set ups ready! DO NOT ENTER without a trade plan and especially without a stop loss.

Technical Levels to Watch For This Week

STI

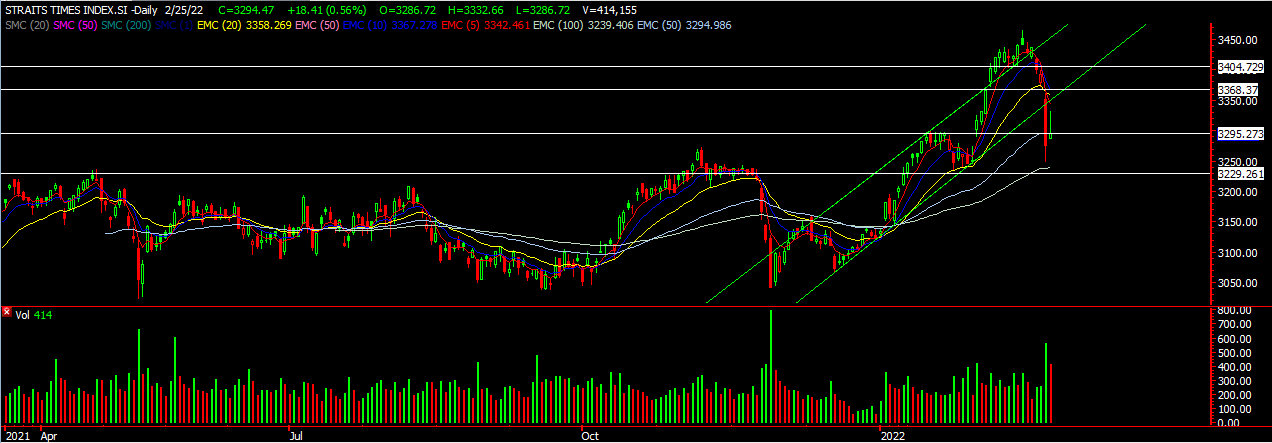
As we kept cautioning about a possible retreat in the STI, it has happen and with such ferocity. It has broken below that lower uptrend support line and went straight down close to the 100ema support which is also near a horizontal support of around 3229. As market pullback, take this opportunity to pick up the local banks! =) STI might stage some rebound in the coming week and start consolidating of a range between 3280-3360.

HSI 

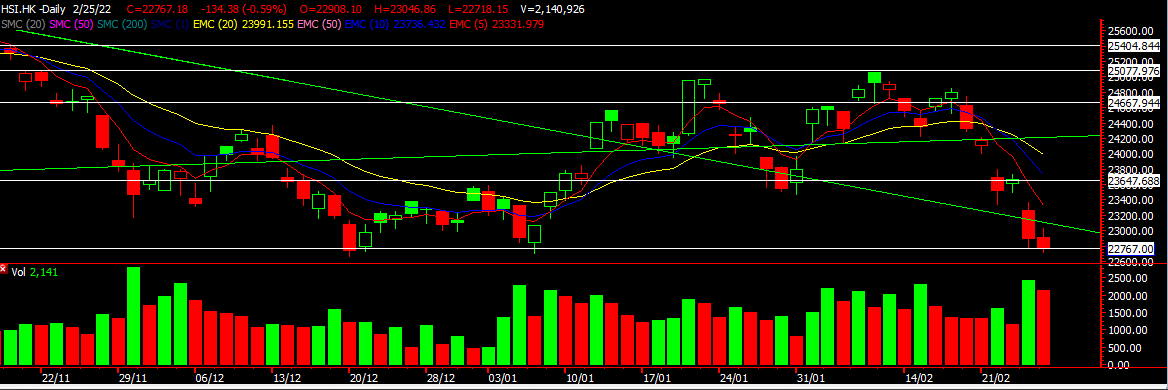
As HSI came to our first support of 23647 then came another shockwave of fighting erupting over in Europe. This sent the HSI to a deep plunge as investors and traders panic and sold off their positions. A triple support can be seen of around  22767 area and if this holds, we might see the HSI starting a nice bounce to 23647 level. Looking for a bounce this week.

For more analysis on the US market and where it might head to, you can click HERE!

Have a good week ahead!

Yours

Humbly

Kelwin&Roy

The Week Ahead Feb 2022 – [STI, HSI, NASDAQ & S&P]

20th February, 2022, 4:45 PM

The Week Ahead Feb 2022 – [STI, HSI, NASDAQ & S&P]

Another volatile week for the US as Ukraine-Russia tension grew and markets pulled back on fear of war breaking out over there.  China continues to push new regulations with the latest on Friday  issuing guidance for online food delivery platforms to reduce service fees to help to lower operating costs for catering businesses.  This sent Meituan (3690.HK) down 15% . Singapore once again fair better than the West BUT it might be time to take a break from the weeks of gains. As we enter a new week, tensions of war along side with rising inflation will continue to haunt the markets. S&P 500 has also closed below its 200 days moving average, are we expecting more downside? Read on to find out more.

Key Events to Watch For 

Tuesday – CB Consumer Confidence (Consumer Confidence measures the level of consumer confidence in economic activity. It is a leading indicator as it can predict consumer spending, which plays a major role in overall economic activity. Higher readings point to higher consumer optimism.)

Thursday – US GDP Q4, Gross Domestic Product (GDP) measures the annualized change in the inflation-adjusted value of all goods and services produced by the economy. It is the broadest measure of economic activity and the primary indicator of the economy’s health.

Initial Jobless Claims, Crude Oil Inventories

Friday – Core Durable Goods Order (Core Durable Goods Orders measures the change in the total value of new orders for long lasting manufactured goods, excluding transportation items. Because aircraft orders are very volatile, the core number gives a better gauge of ordering trends. A higher reading indicates increased manufacturing activity.)

Technical Levels to Watch For This Week

STI

As mentioned last week, its good for STI to have some pullback so that traders and investors can move in. A spinning top pattern like candlestick formed on Thursday and with Friday’s candle closing lower, we might see more downside this week. Some support levels we’re looking at, 3400 then 3368 first. Banks continue to hold the index up, although we have seen pockets of Blue Chip stocks moving up especially the recovery play ones like SATS, Comfort, SIA Eng and even Thaibev. We’re continuing to focus on these recovery stocks.

HSI 

Just as HSI was gaining some grounds, but China  has decided to enforce more regulations regarding online delivery to reduce their service fees to spur greater economic growth. That sent the HK markets into a dive sparking another round of sell off as investors worry of more regulatory crack down. Tencent, Alibaba, JD all took a hit and we’ll wait for a base to form once again to look for entry. HSI might see more downside to about 23647 before finding some support

S&P 500

The S&P 500 has closed below its 200 days moving average for 2 days straight. Its not a good sign and has to regain above this in the next 2-3 trading days if not be prepared for more downside. Overall, if S&P 500 tests the previous low, we’re only at about 12%  correction which is still possible for a further downside to even 15-18%. So hang on tight as markets grapple with the ever changing tune of Russia- Ukraine tension. Bracing for more downside. to 4290 first.

Nasdaq 100 

Nasdaq also is below the 200 moving average for the past week and is structurally weak which signals more downside. Tech stocks continue to struggle with ongoing concerns of more rate hike throughout the year. A pullback to 13448 wouldn’t be surprising as that would represent about 20% price correction.

Hang in tight if you’re invested into fundamentally good stocks with wide economic moat.

For traders, do stick to your stop loss and be disciplined especially during such times. Hedging is also a strategy to adopt for this year as we uncover the benefits and reasons for this strategy last week.

Have a fruitful week ahead.

Yours

Humbly

Kelwin & Roy


Wilmar – [ Why It Could Move Higher ]

16th February, 2022, 7:50 PM

Wilmar – [ Why It Could Move Higher ]

Chart source: AdvisorXs 16th Feb 2022

Wilmar has seen a move of  7% in just over a week since our alert to our clients. It was Wilmar’s turn to shine as inflation brings a rise in commodity prices and in turn commodity related counters. It is currently at some resistance of around $4.76 and a pullback is healthy. The lower end of this pullback might be around $4.55 before we see another push up.  The next upside resistance we might see is around $4.97.

In order to hold your trade longer at a fraction of the cost, a trader can utilize CFD to give his  or her trading a BOOST!

A reason why Wilmar might continue to see its price trend higher is that it had a long consolidation ever since October hovering around the $4 to $4.40 price range. It has now broken above this resistance and might be challenging the $5 mark in the coming weeks. Also, with inflation , commodity counters tend to perform well too.

As the year starts, fund managers are also looking to load up on quality blue chip to ride this inflation environment.

If you’re keen to know how to free up your capital and to trade on a lower capital,  then do join us in our upcoming WEBINAR where we’ll show you how to hold on to your winning trades in order to ride the trend!

Date: 17th feb

Time 8-9pm

Register HERE! 

To be a client to receive such awesome trade alerts CLICK HERE! 

Yours

Humbly

Kelwin & Roy

The Week Ahead Feb 2022 – [STI, HSI, NASDAQ & S&P]

13th February, 2022, 3:48 PM

The Week Ahead Feb 2022 – [STI, HSI, NASDAQ & S&P]

The start of the week was a good one for Asia markets as we saw many of our Asian counters hitting their porfit targets. But as the week drew to a close, hot inflation numbers spook the markets, sending the 10 year yield curve temporarily above 2%. To add fuel to the fire, talks about an emergency fed meeting to raise rates before March further escalated the drop. Goldman even sees Fed hiking rates from 5 to 7 times this year which caused further panic.  Also, Russo-Ukrainian war continues to spark fears in the market causing the S&P500 to drop even more on Friday but Oil gained an upper ground.  All in all, Asia continues to outperform the US markets.

Key Events to Watch For 

As tension carries on this week, keep a lookout for development on the Ukraine front and watching fed to see any updates from them.

Tuesday – PPI (The  Producer Price Index (PPI) measures the change in the price of goods sold by manufacturers. It is a leading indicator of consumer price inflation, which accounts for the majority of overall inflation.) Watch this!

Wednesday– Core Retail Sale  ( Core Retail Sales measures the change in the total value of sales at the retail level in the U.S., excluding automobiles. It is an important indicator of consumer spending and is also considered as a pace indicator for the U.S. economy.)

Crude Oil Inventories – Oil traders take note to see how bullish oil will be

Thursday – Building permits & Initial Job Claims

Technical Levels to Watch For This Week

STI

The STI continues to outperform the markets and even our expectations pushing up higher this week. We’re glad a lot of our counters are finding their profit targets with some hitting over multiple targets in the week.  STI has been up close to 2 weeks already and it might be time for some healthy pullback if not it’ll be tough for re-entries. We’re eyeing a pullback to 3366 level. So far, the banks are once again pushing the index up while other recovery counters like comfort and sats are also pulling their weight.

HSI 

Over in Hong Kong, the markets got a boost as reports of China State funds buying stocks to help stem declines. Covid cases continues to raise and strict measures are in place to curb the spread. HSI has hit our short term upside target and pulled back to a level of support both horizontal and the 5ema. With a few negative sentiments out now, we’re cautious going into this week. If the 5ema doesn’t hold, we might see it get pushed down to the 20ema of around 24330 area.

For more analysis on the US market and where it might head to, you can click HERE!

Have a good week ahead!

Yours

Humbly

Kelwin&Roy

SGX – [ Meeting Expectations, How To Swing This Trade]

9th February, 2022, 7:44 PM

SGX – [ Meeting Expectations, How To Swing This Trade]

Chart Source: Advisor XS 9th Feb 2022

The Singapore Exchange or SGX for short reported its results on Monday and most analyst were satisfied with the results. The biggest rerating came from Citi analyst upgrading it from a sell to a buy rating with a price target of $10.50. Some highlight of its results :

For the 1HFY2022 ended Dec 2021, SGX reported earnings of $219 million, down 8% y-o-y; adjusted earnings, which SGX claims is a more accurate reflection of its underlying earnings, was down 2% y-o-y.

Revenues of $522 million were flat y-o-y with higher operating expenses of $262 million, up 6% y-o-y, and operating profit of $260 million, down 7% y-o-y.

With more interest in local SPAC (Special Purpose Acquisition Company) listings , this could also support market velocity and fees moving forward for SGX.

Technical Outlook 

As we spotted SGX just a month back when it started to break above its downtrend line, it started to show resilience despite a negative sentiment around that time. For contra players, they might have taken some profits as SGX has risen in a few days. But in order to maximize the trade, a trade might consider using CFD in order to swing in with minimal cost. As our alert was at $9.50, we have seen SGX swinging to a high of $10.03 up over 5%.

There is some resistance between the range of $10.03 -10.10 and overcoming it might see SGX move up to , momentum and volume is building up for SGX and we might see it move to $10.50 before taking a break.

In order to ride the this trend, a trade has to either trade in or out or purchase the share. To know how to swing such a trade at a fraction of a cost and free up your capital then do join us in our upcoming WEBINAR where we’ll show you how to hold on to your winning trades in order to ride the trend!

Date: 17th feb

Time 8-9pm

Register HERE! 

To be a client to receive such awesome trade alerts CLICK HERE! 

Yours

Humbly

Kelwin & Roy

Sembcorp Industries – [Time to Bail? ]

7th February, 2022, 7:22 PM

Sembcorp Industries – [Time to Bail? ]

One of the stronger blue chips beside the bank, Sembcorp Industries has seen over 20% rise just over a month! A fantastic run if you ask us especially in the Singapore market. Since 27th Dec, we have alerted our EXCLUSIVE CLIENTS when Sembcorp Industries broke above it downtrend line. From then on it started its upwards move and right now, we are seeing some resistance.

What should we do? The candlestick pattern looks like  a shooting star which we must take note of. The volume has increased but it couldn’t move higher with a nice hollow candle finish.  A trader might consider taking some profits off the table as it has also touched our $2.49 resistance. There are a few ways to exit this trade and one of them would be when it closes below the 5ema. Another way is when it breaks the uptrend line we drew. One last thing, remember your time frame is also important. Whether you’re an investor or trader.

In order to ride the this trend, a trade has to either trade in or out or purchase the share. To know how to swing such a trade at a fraction of a cost and free up your capital then do join us in our upcoming WEBINAR where we’ll show you how to hold on to your winning trades in order to ride the trend!

Date: 17th feb

Time 8-9pm

Register HERE! 

To be a client to receive such awesome trade alerts CLICK HERE! 

Yours

Humbly

Kelwin & Roy

The Week Ahead Feb 2022 – [STI, HSI, NASDAQ & S&P]

6th February, 2022, 2:31 PM

The Week Ahead Feb 2022 – [STI, HSI, NASDAQ & S&P]

It was a choppy week over in US as the S&P 500 pulled itself out of the weekly 200SMA but saw a pullback during the week. Major companies reported their Q4 earning with Meta missing its earnings and giving a disappointing Q1 guidance. The 10 year yield curve also spiked up to 1.9% which caused some markets jitters. As Asia was on a longer break, most of the markets remained up despite the negative sentiments out there.

Key Events to Watch For 

Wednesday – Crude Oil Inventories.  The level of inventories influences the price of petroleum products, which can have an impact on inflation. If the increase in crude inventories is more than expected, it implies weaker demand and is bearish for crude prices. The same can be said if a decline in inventories is less than expected.

Thursday – Initial Jobless Claim

Friday – US Fed Monetary Policy Report. This is the fed reserve board submits written reports to Congress containing discussion he conduct of monetary policy and economic developments and prospects for the future.

This coming week there will be more earning results like Pfizer, Pepsico, Disney and tech firms such Twitter, are
Remember to refer to below link to see Earnings calendar of your favourite companies.

Take note of the 10 year yield curve too.

Technical Levels to Watch For This Week

STI

We saw a push up for the STI after a short pullback  which is a bullish sign as it broke above the 3300 level. We might see it push higher during the coming weeks to 3350 level before another pullback occurs. Banks, travel stocks, E stocks are seeing rebound too. Stocks like Keppel Corp and Sembcorp Industries are shining too.

HSI 

It had one full day of trading last Friday but saw a huge catch up and closed up over 3%. Its considered a lot for an index to move 3% in a day. After a pullback, HSI has risen again and we might look for it to test the upside resistance of 25077 area and even 25404.

For more analysis on the US market and where it might head to, you can click HERE!

Have a good week ahead!

Yours

Humbly

Kelwin&Roy

Live Webinar : Protecting Your Portfolio Against Volatility with CFD.

3rd February, 2022, 6:13 PM

Good Evening, in TWO WEEKS TIME we’ll be holding our webinar on Protecting Your Portfolio Against Volatility with CFD.

With high inflation and Fed rate hike concerns plaguing the markets, January was brutal with S&P500 correcting over 12%. Even fundamentally good companies such as Microsoft corrected over 18%.

One question we get asked often is, how can we protect our longer-term portfolio while we wait for the correction to end?

Is there a way where we can profit from these corrections while holding on to our investments?
After all, market corrects an average of 2-3 times in a year.
So how do we prepare ourselves for the volatility ahead?

In this 1.5 hours special webinar, we will be sharing on:
– Why hedging is critical this year
– Hedging your portfolio against volatility
– Trend trading with little capital
*- Trading the Index *
– Riding the commodity boom with CFD
Bonus: We will also share 2 stocks you can potentially look at to trade using Poems CFDs

Register below to reserve your slot as we have limited capacity.

https://us02web.zoom.us/webinar/register/WN_tHHD1mG_Rv6ODO0imIp7ag

See you in this webinar as we will share how to use CFDs to better equip yourself this year.

There will be no recording provided for this webinar so be sure not to miss it!

LIVE Webinar Details
Date: 17 Feb 2022 (Thurs)
Time: 8-9:30pm

Yours

Humbly

Kelwin& Roy