Sembcorp Industries – [ Breaking Support? How Does The Chart Look? ]

29th May, 2020, 11:24 AM

Sembcorp Industries – [ Breaking Support? How Does The Chart Look? ]Sembcorp Industries 29th May 2020

Chart Source: Poemsview 29th May 2020

Sembcorp Industries a STI component stock has largely seen a sideways consolidation since March. The range it was trading is around $1.47-$1.64.

What caught our attention is that Sembcorp industries seems to have broke its horizontal support of $1.47. If  it doesn’t regain this footing, we might see it move lower in the coming days and weeks. The downtrend line acts as a resistance and until it manages to break above that, Sembcorp Industries might continue to be weak.

It’s already at its 10 years low, so how low can it go?? What’s your trade plan like? $1.40 might be on the cards if it does stay below $1.47 in the coming days.

Yours

Humbly

Kelwin&Roy


City Dev – [ Developing A Bearish Trend? ]

24th May, 2020, 7:27 PM

City Dev – [ Developing A Bearish Trend? ] City Dev 24th May 2020

Chart Source: Poemsview 24th May 2020

City Dev part of the STI component and a leading global real estate property developer. It saw some heavy selling last friday due to the unrest in Hong kong.

Now is City Dev in bearish terrority? From the technical charts we can see that it is below the 200ema. A stock that is below this long term indicator is considered bearish from a chartist point of view. With that and also breaking the short term uptrend line we drew we ALERTED our CFD Clients on a potential short.

CFD Clients were alerted on 13 May when City Dev broke the uptrend line and also below its 20ema. City dev continue to slide down to our first target of $7.56 and is now just 2 cents to our second target of $7.36. City dev was trading at $7.37 at close.

The volume traded last friday was rather high and this might signal more downside if it breaks the horizontal support of 7.34. The next downside target might be 7.03!

Want to be part of this EXCLUSIVE GROUP that were alerted of such a trade analysis?

Wait no more! CONTACT US NOW to see how you can be part of this group to receive value added service sent straight to your handphone.

Yours

Humbly

Kelwin&Roy

Straits Times Index – [ Where Is The Support At? What’s The Game Plan Now? ]

22nd May, 2020, 3:55 PM

Straits Times Index – [ Where Is The Support At? What’s The Game Plan Now? ]Straits Times Index - 22nd may 2020

Chart Source : poemsview 22nd May 2020

Its close to 4pm now and the Straits Times Index is down over 50 points due to China tightening its grip on HK.

Hong Kong index is down over 1000 points or 5%, something which we haven’t seen in awhile. Due to the regional unrest, our Straits Times Index or STI also is affected . We’re down about 2% at the time of writing.

So what’s our game plan? If you noticed we’ve been rather bearish on the markets and continue to remain so until we see more convincing signs of rebound. With every rebound in the STI it seems to be making a Lower High despite US side having massive gains. This to us shows some weakness. STI is currently on its horizontal support of around 2500.

What could happen from here? Some possible scenarios:

  1. STI could have a rebound to cover the gap and test the downtrend again. Failure to break that might see more downside. If STI manages to break that downtrend line then our stand might change.
  2. STI could break the horizontal support level and might take us to around 2387 levels.
  3. STI could possibly hover around here and form a sideways consolidation before another move comes.

So stay alert! We’re eyeing more downside as you can see STI is below the moving averages but are flexible to react as market remains volatile and remembering the saying, Don’t Fight The Feds!

Want a  quick discussion on the market direction?

Feel free to drop us a line!

Yours

Humbly

Kelwin&Roy

S&P 500 – [ Sideways Consolidation, Stay Alert! ]

19th May, 2020, 7:31 PM

S&P 500 – [ Sideways Consolidation, Stay Alert! ]S&P 500 19th May 2020

Chart Source : Poems2.0

It was a very strong finish over in the USA as stocks surge on positive news of a vaccine by moderna. 

That surge took the S&P past its 200ema on its daily chart which is a positive sign if you’re on the long side. On the daily chart we can see its on a bigger sideways consolidation from about 2760 to around 2968 levels.

If S&P 500 does break above the 2968 level we might see it move to the next possible level of  3100. Many have been skeptical of the rally so far and to be fair we have been too. S&P 500 have rebound about 30%  since the low and is just about 13% off from the high. Its quite hard to imagine that given all the bad economic data that has been coming out. With unemployment data at its all time high, people calling this worse than the great depression. But one thing that  other traders are mentioning is ‘don’t fight the feds’ . They have been quick to respond to the crisis, printing and pumping trillions into the markets.

Though we have caught some downside, we would have wished for a lot more but if market at this point in time is not going down, let’s follow the trend and see where that takes us to. It could be a false breakout at this level so stay alert! Don’t give up yet!

If you like to have a discussion on the markets feel free to drop us a line. 

Yours

Humbly

Kelwin&roy

Yzj Shipbldg – [ At Support, Will It Break? ]

6th May, 2020, 8:56 AM

Yzj Shipbldg – [ At Support, Will It Break? ]Yzj Shipbldg 6th May 2020

Chart Source: Poemsview 6th May 2020

Yzj shipbldg is sitting on its uptrend support line and the 20ema. A break of that might see it move lower to the next support level which we have drawn.

It is currently also resisted by the downtrend resistance line. Which camp are you on? The bulls or the bears?

We’re more inclined towards the downside. Lets watch in the coming days.

If you want to learn how to use Poems CFD to short the markets feel free to drop us a message.

A trader who only knows how to go long and now short has lost half the battle already! So picking up a new skill during this period is critical!

Yours

Humbly

Kelwin&Roy

S&P 500 – [What Now After Hitting Our Resistance]

4th May, 2020, 8:05 AM

S&P 500 – [What Now After Hitting Our Resistance]

S&P 500

Chart Source: Poems2.0 3rd May 2020

It was a week where the bulls were seemingly in control and a string of good news with some not so bad earnings coming out from the big tech companies. But towards the end of the week, the S&P started to have some profit taking.

From our previous blog regarding the S&P 500, it has  actually gone up to the weekly 50ema which we highlighted, the area where we will turn cautious and will be looking out for short opportunities. As the S&P 500 roared through the weekly 50ema, traders were turning bullish and started piling up their longs thinking that market will continue to trend higher. Sadly, S&P 500 made an intra day high of 2972 and started to fall back down.

We are continuing to look for short opportunities and S&P 500 might fall to about 2725 area first in the coming days – weeks and breaking that support might see more downside.

We will update more as time comes. Hope you learnt something from our post and if you’re interested in learning how to use Poems CFD to short the market, do drop us a message.

A trader who only knows how to go long and now short has lost half the battle already! So picking up a new skill during this period is critical!

We also shared a video analysis on the S&P 500 previously, so do head over to our facebook page to check it out!

Yours

Humbly

Kelwin&Roy


DBS – [ Rebound or Down? ]

23rd April, 2020, 7:07 PM

DBS – [ Rebound or Down? ] DBS 23rd April 2020

Chart Source: Poemsview 23rd April 2020

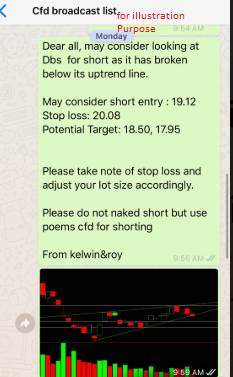
DBS has been seeing selling in its shares for the past week. It broke down from our uptrend line and also the 5ema which gave us some conviction to alert our CFD clients on this potential analysis.  To add further pressure to the already stressed up system, news came out regarding Hin Leong Trading.  Many banks were involved in this high profile cases now.

As DBS broke its uptrend line of 19.12, the downward pressure came in and took it down to our first target of $18.50. We saw a slight rebound and a test of the 5ema but DBS failed to gain footing above it.

If DBS can’t close above this in the next few days we might see more downside. Which camp will you be on?

Want to be part of this EXCLUSIVE GROUP that were alerted of such a trade analysis?

Wait no more! CONTACT US NOW to see how you can be part of this group to receive value added service sent straight to your handphone.

Yours

Humbly

Kelwin&Roy


SATS – [ Down It Goes Again, Catching It For The Second Time]

15th April, 2020, 6:38 PM

SATS – [ Down It Goes Again, Catching It For The Second Time] SATS 15th April 2020


Chart Source: Poemsview 15th April 2020

SATS is the leading provider of gateway services and food solutions in the region. It is a familiar sight to many Singaporeans as they depart from Changi Airport. SATS is also part of the STI component stock.

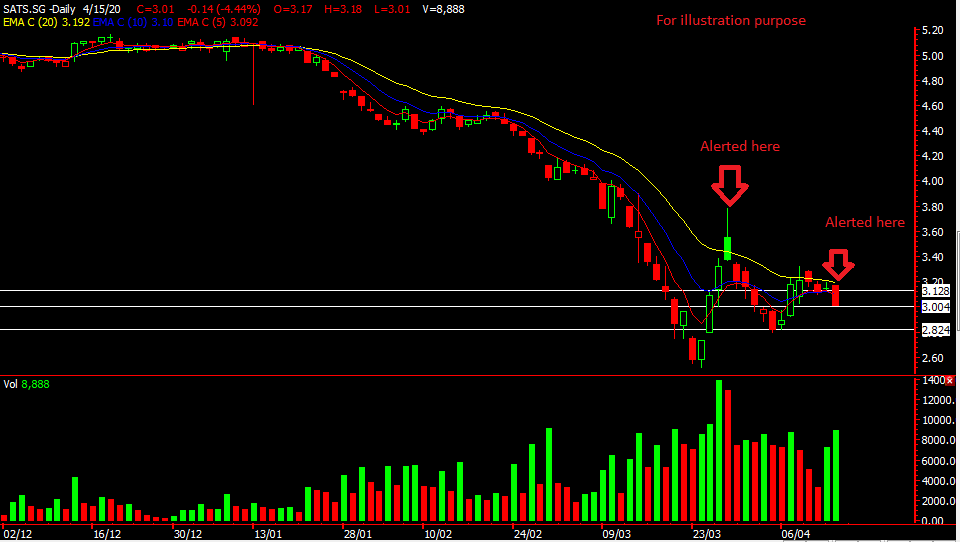
Given the drop in tourism, SATS would be adversely affected due to the decrease in flights . Our airports are almost empty with SIA cutting 97% of their capacity. SATS would be hit badly and if you would want to ride the downside then shorting using CFD would be a way to do so.

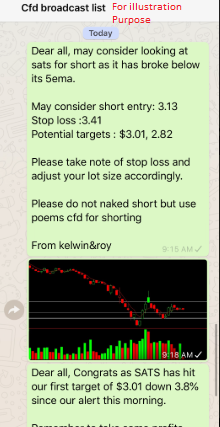
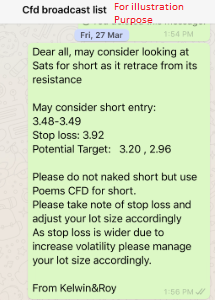
Our CFD clients were alerted of such an opportunity once in end march at $3.48 and another time today( 15th April). As SATS tried to rebound for the last week, its rebound might come to an end and resume its downwards trend for now. SATS hit our first target of $3.01 and from our analysis we are setting our next possible target at $2.82.

Want to be part of this EXCLUSIVE GROUP that were alerted of such a trade analysis?

Wait no more! CONTACT US NOW to see how you can be part of this group to receive value added service sent straight to your handphone.

Yours

Humbly

Kelwin&Roy


STI Updates – [ Support & Resistance Levels]

14th March, 2020, 10:28 PM

STI Updates – [ Support & Resistance Levels]Straits Times Index - 14th March 2020

Chart Source: poemsview 14th March 2020

What a week right? A rough week would probably be an understatement! Oil crashed, Dow crashed, Yield crash, limit down, limit up and there is still no sign of Covid-19 letting up.

But hold steady and lets have faith that we’ll get through this together. By now, we’re sure Covid-19 is no stranger to the world. Its been grabbing headlines for all the wrong reason and markets are plunging due to fear of how this virus will impact the economy. We’ll still continue to look at our charts to find some clues on when the selling might subside or when a technical rebound might come.

For our STI, we have drawn some support and resistance levels and will be using it as a guide to try to navigate through this crazy times. The first support we see is at around 2510 level, the low of 2016. It had some rebound from there on friday and a good rebound might see STI to close to 2700. We’ll take things step by step for now and after 2700 then 2750 area. The support for us is at 2510 then 2415.  No one can tell when the market will bottom or where the top is therefore its important to have the right mentality when investing or trading.

Don’t fish for the bottom but plan your investment in batches.

Take care when trading and its always good to have an extra pair of eyes to look out for especially during this period.

Have you prepared your shopping list? Drop us a message and we can discuss more.

Yours

Humbly

Kelwin&Roy


Dow Jones – [ Covid-19 Hits Hard, 7 Days Drop Wiping out 7 months of gains, What’s our plan now? ]

2nd March, 2020, 8:39 AM

Dow Jones – [ Covid-19 Hits Hard, 7 Days Drop Wiping out 7 months of gains, What’s our plan now? ]

Chart Source: Poems2.0

Fear, anxiety, panic gripped the markets last week as traders and investor ran for the exit door.

It was the fiercest and fastest sell down since the 2008 financial crisis. 1000 points drop almost day after day which caused even the gutsiest of traders to flee. The week was just marked with panic selling just as Us markets made new high. Any rebound was met with even more selling and the market succumb nosedive of about 14% for the week.

South korea had the biggest jump of number of infected with over 3700 people infected in just over a week. This caused a huge alarm and panic as South Korea scrambled to contain the outbreak mostly in Daegu.

Italy also reported a surge in cases bringing the total number of cases to over 1100 the second largest infected outside China.

Iran also saw an increase in cases and what was puzzling was that Indonesia has so far not reported any cases. Has market priced in a potential case in Indonesia? US also warned of community spread in its country.

WHO ( World Health Organization) also raised its risk assessment to the highest level warning countries to get ready and be prepared!

All these mixtures of bad news made a perfect storm and reason for selling. And Selling it was!

The 10 year Treasury yield which is a key indicator in global finance also hit a record low on Friday , another sign that investors are fleeing equities for the safety of bonds.  The Cboe Volatility Index also known the VIX surged to its highest level since the Great Recession, warning  that there might be more volatility ahead.

Dow Jones went into correction territory just within the week plunging close to 5000 points from high. Selling was the order of the day even though Trump tried to calm the markets. We all know how bad this week was and so lets  take a deep breath and look ahead to the week. We have drew the chart for Dow Jones with the trendline support and resistance on the chart. Here’s our simplified game plan for the week.

  1. Looking for a rebound (Daring traders might look to long on reboud)
  2. If the rebound is strong and could reach our resistance we might consider to go short.
  3. Market could test the low or even break friday’s low after the rebound.

Stay nimble and watch the charts and news as things could escalate any moment or will Fed come in to rescue the markets?

It’s been a very tough week for all and if you’re feeling depressed and defeated by the market its perfectly understandable.

We’re always here just a message away if you need a second opinion.


Yours

Humbly

Kelwin&Roy