Wilmar – [ Anymore Room For Upside After Such A Strong Run?]
chart source: Poemsview 9th Jan 2021

Wilmar had a nice upside of over 20% since its base was formed around $4.2 in early December. We alerted our EXCLUSIVE CLIENTS back in late Nov when Wilmar started to show some signs of interest. Holding on to this trade saw a saw eventual upside of over 15%. In order to hold on to this trade, one could either pay up fully or consider using some leverage instrument like CFD. This enables the trader to hold on to the trade for a longer time if one feels that the stock has more upside potential.
For now lets take a look at Wilmar’s chart and see if there is more room for upside. Wilmar had been having share buy back around Nov 2020 to even in Jan which could be a reason for the recent spike in price. It has risen about 20% from December and the next potential target might be around $5.20 level. The risk reward for now isn’t favourable in our view and would prefer for a pullback to the 5, 10ema or the uptrend support line. If we missed this trade we would prefer to wait and not chase or maybe look at another stock rather than trying to buy high and try to sell higher.
Want to learn more about CFD? We made some videos on it so just click HERE to learn more and of course if you have questions feel free to drop us a message.
Also, if you want to get such trade alerts straight to your handphone with such a follow up service,
Then be our EXCLUSIVE CLIENT and find out how much value is waiting for you!
See you onboard soon!
Yours
Humbly
Kelwin&Roy


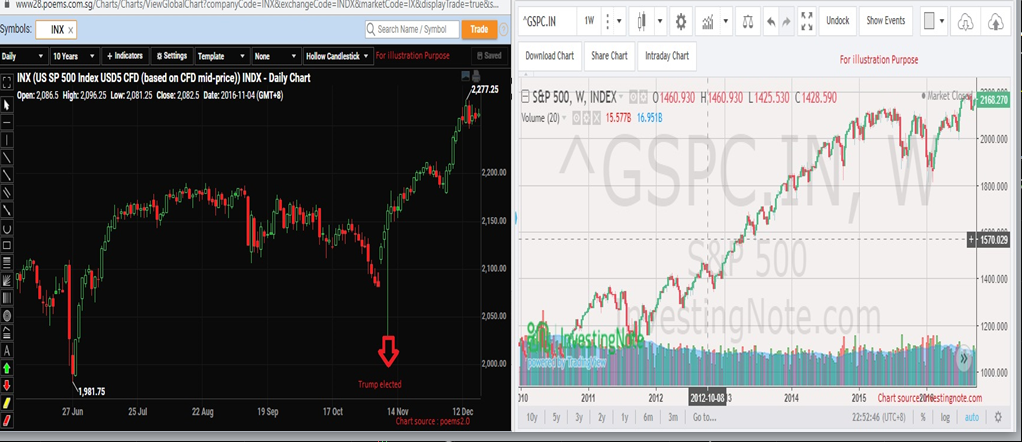


![S&P 500 – [ Crash? Stress? Distress? Let’s Confess, No One Can Predict A Crash, Our Two Cents Worth]](http://singaporehumblestock.com/wp-content/uploads/2020/10/SP500.png)