23rd April, 2021, 8:00 AM
Looking At This HK Stock, Are You Too?

This HongKong Stock has corrected over 30% since its peak of HK$422.80 to a low of $284. This sell off was partly due to a market correction, SEC adopting delisting lsaws and the recent anti-trust crackdown on tech giants.
The stock that we’re talking about is Jingdong also known as JD.com (9618.HK). JD.com is a Chinese e-commerce company and is one of the two massive B2C online retailers in China by transaction volume and revenue. Its major competitor is Alibaba-run Tmall. JD.com operates online retail and marketplace platform. Jingdong (JD.com) annual active customer accounts increased by 30.3% to 471.9 million in the 12 months ended December 30, 2020, from 362 million in 2019.
JD.com also has a logistics arm. It is one of the largest and most automated fulfilment centers in Asia and offer one of the best supply chain solutions. They are looking to list their logistics unit in the next nine months.
JD also has cloud &AI platforms which is powering it into the future. It has also got JD Health which has went IPO.
Now lets take a look at some of its financials.

Chart source: seekingalpha.com
It has been growing consistently and with 2020 revenue at 745,802.

Chart Source: seekingalpha.com
operating cash flow also sees a steady increase. 
Net income is finally rising as they were spending more in the past for their growth.
And now lets take a look at the chart

Chart Source: Poemsview 23rd April 2021
As we can see, some support could be seen at around HKD$283 which is around gap support and if that fails to hold we might see it cover gap to around $267. As an investor, we always preach time in the market and not timing the market. When a quality stock like JD.com has fallen over 30% think this might bring some interest to those long term investors as this might be a chance to scoop up some shares at a discount. Scaling in and not going in all at once is something that we do. Go in by batches as nobody knows where the bottom is. Common indicators are at the oversold region too. IF JD.com can break above the downtrend line and the 20ema this might be the start of a reversal in play. Watching closely!
Remember that investing do carry risk and always consult your advisor first.
If you would like to know more, just drop us a line!
Yours
Humbly
Kelwin&Roy


![Innotek – [ Will The Uptrend Continue? Late In The Trend? ]](http://singaporehumblestock.com/wp-content/uploads/2021/04/innotek.png)
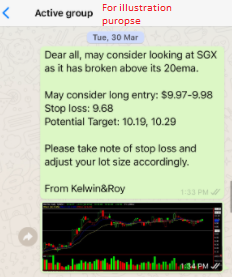
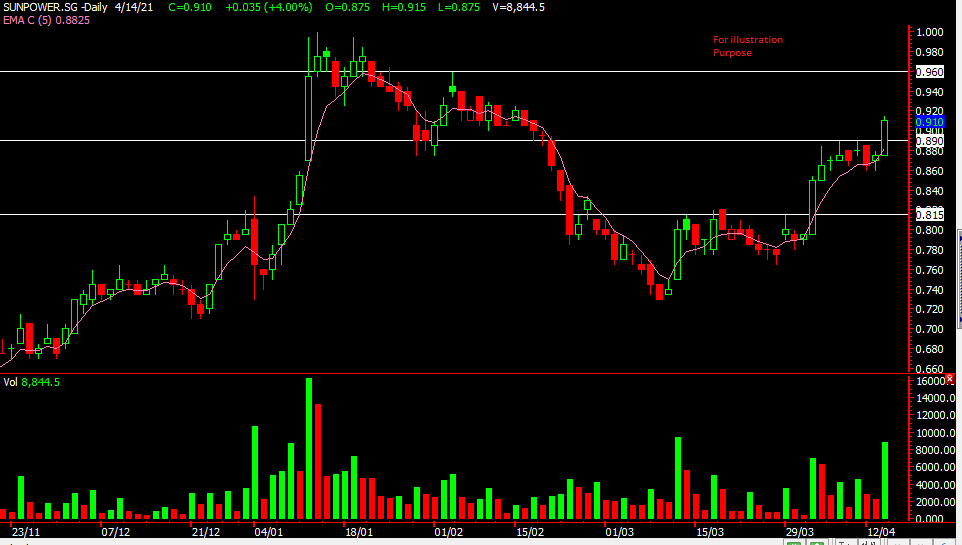
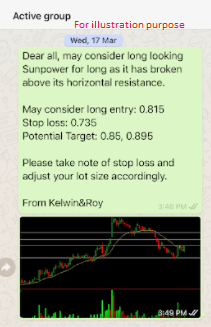
![Sunpower – [ More Than 10% Power Up In Less Than A Month! Further Upside? ]](http://singaporehumblestock.com/wp-content/uploads/2021/04/sunpower-msg.png)