The Week Ahead April 2023 – [STI, HSI, NASDAQ & S&P]

23rd April, 2023, 3:00 PM

It was a rather poor showing for the markets for last week with only the STI surprisingly resilient. Despite a stronger than expected GDP data from China, that failed to boost markets and Biden’s push for China investment curbs also caused the China/HK market to sink.

Major tech companies like Microsoft, Amazon, Meta, Alphabet will be releasing their results this week. Companies like VISA, Mastercard will also be reporting and focus will be on how their quarterly results to see if consumption/spending has come down and their forward statement and any clues to whether we will be heading into a recession.

Some data to focus on would be US GDP and initial jobless claim on Thursday then fed’s preferred indicator which is the core PCE  data on Friday.

On the home front, UOB will go XD at the end of the week which also could cause some weakness as investors might start selling shares of UOB after it goes XD.
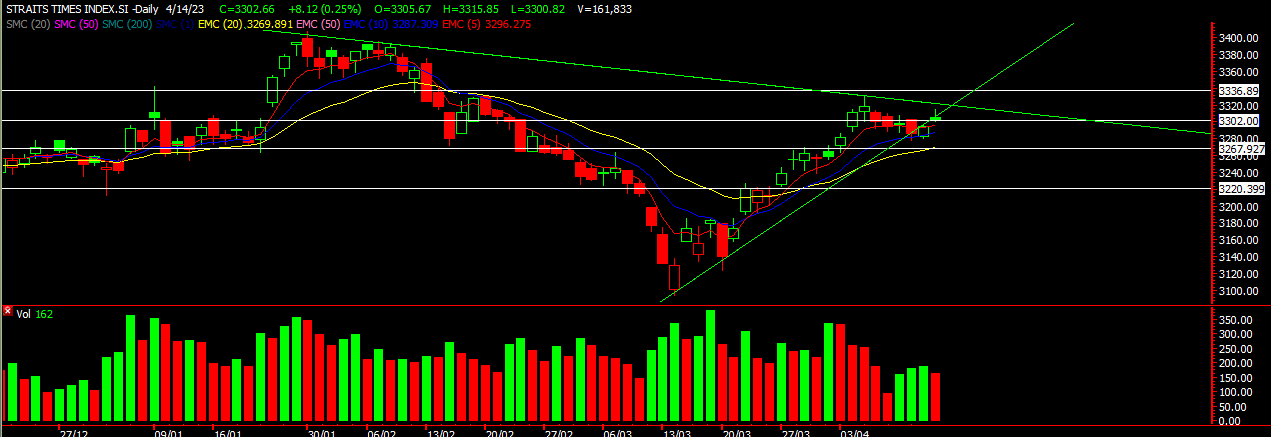
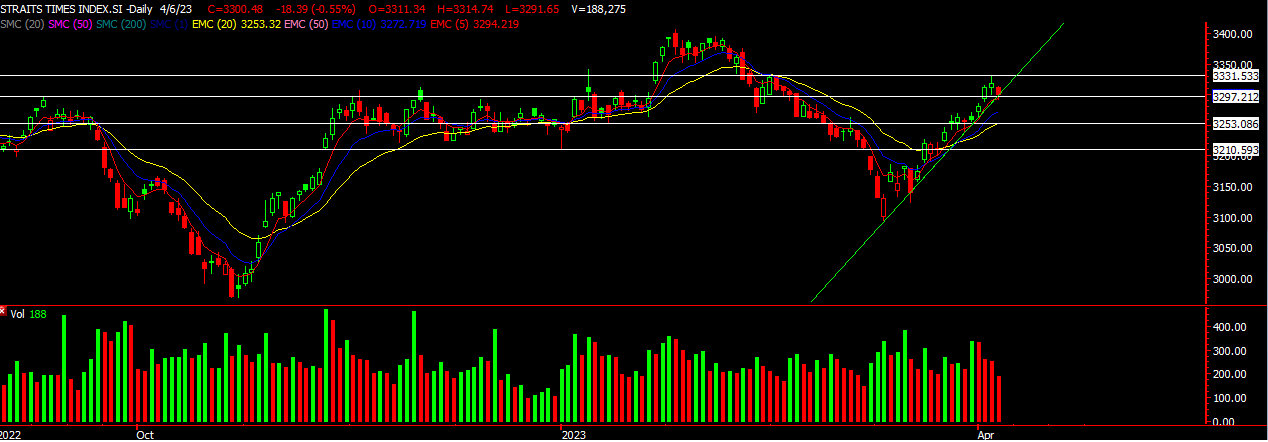
STI


Straits Times Index 23rd April 2023

Chart source: DZH International Advisor 23rd April 2023

STI was surprisingly resilient. With stocks, like Keppel Corp, Sembcorp Industries,Capitaland Invest. all pushing up through the week.  Keppel Corp also gave its business update which could explain the push up for the week.

The STI near term resistance is at around 3332 level and if we do break this on good earnings results then we could see the index move up to the 3380 level. For the support, the first level is at around 3302 which is also the 10moving average indicator. If that breaks on negative sentiments, we could see it go as low as 3267. We’re expecting a bit of volatility as the earnings could surprise on the upside but recession fears could once again bring the markets down after.

Investors still remain cautious firstly because the STI has actually seen about 7% gain since the low in march and have not seen any significant pullback ever since. Investors could be waiting on the side lines for a further pullback before establishing any position hence we see our STI relatively flat
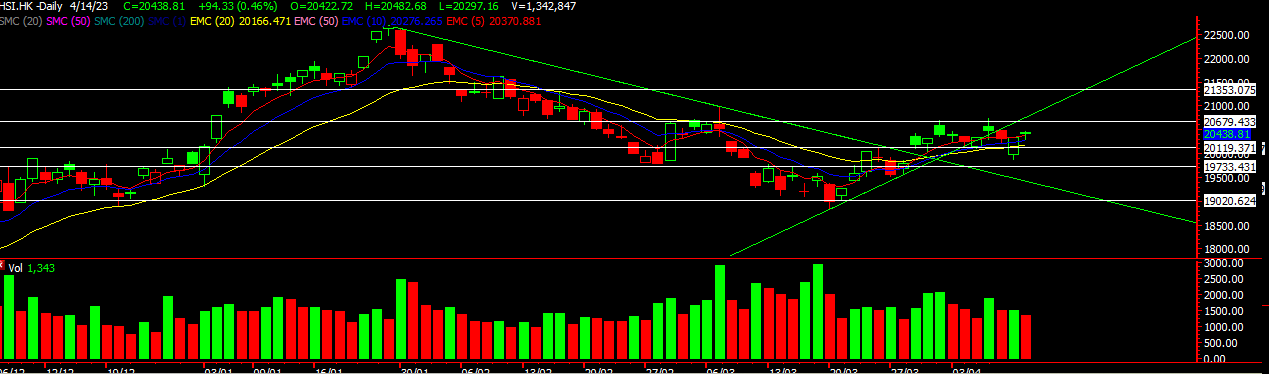
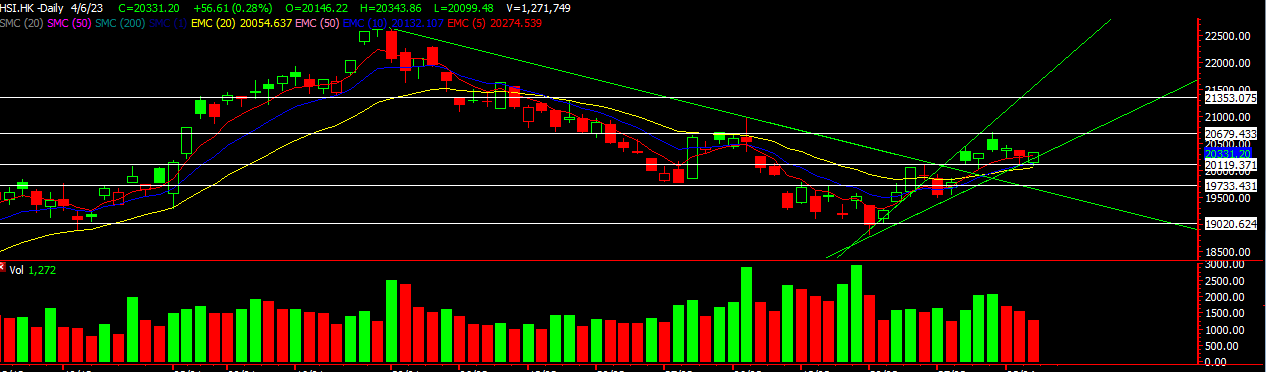
HSI

Hang Seng Index 23rd April 2023

Chart source: DZH International Advisor 23rd April 2023

HSI saw selling pressure despite better data from China which meant weakness. A further political move by Biden gave more reason for more selling which saw HSI falling close to its 200ema.

For this week, most likely we should see this support being tested and we could even see more down side to 19050 area. Many fake break out last week and no doubt some injured traders along the way which is part and parcel of the journey so fret not! If you want to take advantage of the downside, using CFD or DLC are some the options. HSI short term remains weak but for long term investors, time to look out for entry points.

Head over to our Facebook to find out more about view on the US markets.

Yours

Humbly

Kelwin & Roy


The Week Ahead April 2023 – [STI, HSI, NASDAQ & S&P]

16th April, 2023, 11:22 PM


CPI data which market was eyeing turned out lower than expected last week which sent markets on an upwards swing. Despite Initial jobless claim coming in higher than expected, inflation data took center stage as more signs of easing ease inflation fears.

Also, big banks like JPMorgan, Citigroup and Wells Fargo all beat expectation which gave a boost to the markets too.

This week, focus will continue to be on earnings. Corporate results and outlooks will be taking on added importance especially during this season as investors will gauge whether all this interest rate hike is hurting earnings and spending. Consumer discretionary sector stocks like Tesla , J&J , Goldman Sachs are just a few big companies  reporting next week and market will take cue from these earnings.

STI

Source: DZH International Advisors 16th April 2023

STI came off during the start of the week as expected but as CPI data came out, market start creeping up BUT started showing weakness on Friday as profit taking set in. For this week, expecting a drift down first to a test of the 20ema of now at 3270. Stocks in the STI components also looks tired, stocks like Sembcorp Industries, SGX and the banks too. So waiting for more pullback before entering. OR, one can considering a quick short to take advantage of the pullback. 

HSI

Source: DZH International Advisors 16th April 2023

HSI also having a sideways consolidation for now but has closed above the 5ema which is a positive sign for now. We should be looking at more upside for this week given the rebound on Friday. Upside to 20700 first which is also around that uptrend line resistance. Geely, Xiaomi are some of the stocks we’re looking at for this week for more upside. Overall, sentiments flowing from US will help to determine the direction for HSI too.

Head over to our Facebook to find out more about view on the US markets.

Yours

Humbly

Kelwin & Roy

Beware! Pullback Might Be Coming for This Counter!

10th April, 2023, 5:27 PM

This particular counter has seen a tremendous rise and is probably one of the best performing stock for 2022 and moving into 2023.

This counter is none other than Sembcorp Industries! This stock has given us many positive returns through the years and its one of our favourite counter to trade too.

As early as 2021 we started noticing this counter already and has since see positive returns. For 2022 we have given 6 alerts on Sembcorp Industries and have seen many positive returns after.

And for 2023 we have given 2 alerts so far which have seen over 10% upside each time we alerted our clients. You can start to see why Sembcorp Industries is one of our favourite stock now.

But as the saying goes, all good things have to come to an end? But don’t worry, this doesn’t mean the end for Sembcorp Industries. As the recent move as been quite powerful, a pullback is inevitable. We can see that Sembcorp Industries has been trying to break the $4.42 barrier but is unable to do so. Also, this is the first time that Sembcorp Industries has closed below the 5 and 10ema. In addition, indicators  A pullback might be on the cards which could take it to $4.19 first and even $4 for a sharper pullback.

Sembcorp Industries 10th April 2023

Source: DZH international Advisor 10th April 2023

Waiting for a better entry for Sembcorp Industries first before making any moves.

Want to be alerted on Sembcorp Industries next move? Don’t miss the next move!

Contact US to learn how to be included in our next alert!

Yours

Humbly

Kelwin & Roy

The Week Ahead April 2023 – [STI, HSI, NASDAQ & S&P]

9th April, 2023, 4:36 PM

Markets ended flat for the US side as traders looked to book profits ahead of the jobs data and long weekend. Market has been trying to digest the data as recent data might give more insight to an impending recession which is spooking the markets. Focus might start to shift towards recession fears as the narrative about interest rates starts to wane off.

For this week, all eyes will be on the CPI and whether it will further seal the deal for hopefully a final rate hike of 0.25% when the Fed meets in May. A less than expected numbers could give a boost to the markets together with April seasonality. Expecting market to consolidate first before making any move.

STI

Source: DZH international Advisor 9th April 2023

STI rose overall for last week as April seasonally is a better month for the stock market as portfolio managers look to rebalance their holdings and prepare for the next quarter. What was holding up the index also was the banks as their dividend pay out continue to help give support for the index. Profit taking set in after a week’s gain as traders looked to book profit before the crucial jobs data which came in line on Friday.

DBS will be going xd on Monday which could cause some selling as those who held through for the dividends might be letting it go after. We might see some knee jerk reaction to the STI as profit taking. UOB will go xd end of April ( 28th April)

The immediate support for the STI is around 3295. Immediate key psychological resistance is at 3330. A break of the support of 3295 which is also the uptrend support line could take us to around 3252 support level which we could be looking at for the week. After hitting that support, we could see support coming in for the markets as some pullback will be welcomed.

HSI

HSI looks like its rebounding from its recent correct and we could see some upside this coming week. It has closed above the 5ema which is a positive sign. For this week if HSI can remain above this 5ema further upside to 20680 then 21000 next. So far HSI is tracking US a little more taking cue from the world’s biggest market. HKEX looks stronger as its still above its 20ema which most tech stock like Baidu, Jd and Meituan are below.

Do be nimble this week as markets are not out of the woods yet.

Head over to our Facebook to find out more about view on the US markets.

Yours

Humbly

Kelwin & Roy


SGX Trading Festival 2023

28th March, 2023, 2:25 PM

SGX Trading Festival 2023

Humbled and grateful to be given the chance to be speaking at the recent SGX Trading Festival 2023! It was truly an honor to be included in such a wonderful event and sharing the stage with top names in the industry.

We enjoyed the event, from engaging conversations to of course the delicious food and drinks. The atmosphere was warm and energetic and audience were engaging! So good to be able to do a physical seminar once again. Many questions but unfortunately we ran out of time and couldn’t answer them all.

The SGX Trading Festival is still on-going and you can head over HERE to find out more! Don’t miss the chance to listen to the experts on their view on the markets too.

And if you missed our talk on ‘Don’t Fight The Fed?’ We’ll be having a webinar having very soon which I will go through some key points and share some key market updates.

Look out for it

Yours

Humbly

Kelwin & Roy

SATS – Should You Chase It Now? What’s The Upside Left?

27th March, 2023, 9:03 PM

SATS has recently been grabbing the headlines due to their rights and it has also attracted the interest of traders. As the trading of rights were coming to  a close two weeks back, we saw an opportunity for a rebound as the rights overhang starts to fade and the recovery of the stock price starts to come into play. So when SATS was trading around the $2.40 range, with a good support there, we alerted our clients about this potential trade set up.

Fast forward two weeks later and we can see SATS has risen by 10%!  If you missed this trade then the next question is could should I chase this trade or wait? Let’s take a look at the chart and do a quick analysis.

SATS 27th March 2023

From the chart, SATS broke out from its downtrend line with higher volume which is a healthy sign. But it was unable to break above its $2.64 resistance and hence might need some time to overcome this. Once this level is taken out then we might see SATS moving up towards the $2.72 then $2.80 upside resistance. Now that the rights issue is out of the way, a general recovery could come into play.

Yes, you might be a little later in the trade but if you want to get in earlier, then ensure that you’re our client to receive such alerts as soon as possible to make that difference!

Just Contact Us Straight Over HERE to learn how you can be receiving such alerts!

Yours

Humbly

Kelwin & Roy


The Week Ahead March 2023 – [STI, HSI, NASDAQ & S&P]

26th March, 2023, 9:47 PM

The Fed has risen interest rates by 0.25% and further mention that one more rate hike for the year is on the cards and probably no rate cute. With that market volatility set in but as the week came to a close, markets started settling down. Now with fed decision out of the way. What will market be looking forward to and how will the market perform for the week?

Traders will be hoping for some form of stability to return to markets roiled by bank failures in the coming week as they weigh the ongoing fallout from the forced UBS-Credit Suisse tie-up. Upcoming Core PCE Date which is the Fed preferred data could bring some volatility towards the end of the week.

China’s PMI data on Friday will be closely watched as market watchers try to gauge the strength of the recovery in the world’s second largest economy in the wake of the lifting of pandemic restrictions.

Now let’s take a look on the technical front for the various markets.

Nasdaq 100

Nasdaq 100 considered strong as its above the 200ema and what’s interesting is that the 50ema is looking to cross the 200ema. A bullish sign if this happens! Nasdaq remains stronger as traders switch from banking stocks to tech stock and pile in on tech stocks as the 10 year fell. Also, traders look to move in on the recent hot theme on artificial intelligence.  For the week ahead, the key resistance that Nasdaq has to take out would be around 12913. Market has tested that area recently but haven’t been able to break it. As April draws near, a seasonally better month we could see market gathering pace if this banking crisis don’t fallout further. Looking for a bullish break through for the week.

A break below 12373 would be a short term bearish signal for the Nasdaq100.

S&P500

S&P500 slightly weaker as it consist of banking stocks in the index which is dragging the index down. Currently at some congestion which is the horizontal line, downtrend line and the moving average. A break above the 4000 psychological could see S&P500 move higher to the 4100 level. We remain bullish for this week as market tries to stabilize and absorb the bad news around. Support at 3919 and  a break below that might signal more downside to 3811.

HSI

Something interest that we are seeing on the HSI is that its up 3 days in  a row, a rare sight for the last few months. Gaining some momentum on the upside BUT currently facing a few resistance as drawn from the above. A good break above 20,120 could see the HSI push up to 20700 if not we could see HSI consolidate for awhile. Optimistic about a break above this resistance! Support at 19733.

STI

STI which is almost 40% made up of our three local banks largely takes direction from the movement from the banks. Despite the banking crisis we do see our banks hold up pretty well. As our banks are on the safer side, investors are still confident in our banks. For this week, with an increase in interest rates, we might still see a move up after it cross 3225. A move towards 3262 is possible for this week as market tries to find its footing.

If you got any questions as always feel free to drop us a message.

Yours

Humbly

Kelwin & Roy

The Week Ahead March 2023 – [STI, HSI, NASDAQ & S&P]

12th March, 2023, 10:54 PM

It was a disappointing week with Fed’s powell coming up with a hawkish tone that interest rate might continue to go up higher and longer. That sent the markets diving and to add salt to the wound, silicon valley bank (SVB) collapsed over a few days and many are concern over the ripple effect that it might have. Crypto bank silvergate also announced liquidation which added to the chaos. Overall, it has been a tough week ever since Fed’s statement.

Core CPI data another important data which market will be looking closely at to see if Fed will really raise interest rates by 0.5% in the next meeting. Expectations are rising for a 0.5% rise as inflation data is starting to point on an upside.

The Greed and Fear index is returning to extreme fear and we could see a rebound coming soon but with the rebound it will probably attractive shortist and people who needs to cut loss, hence any rebound will be met with resistance.

STI

STI continues to trend down as banks lead the downfall. As Fed continues to pressure the markets and with the fallout of SVB, our local banks also took a hit. We might see STI fall to the next support level of 3150 before planning our next move. Currently the downtrend line is also acting as a resistance. Waiting for a base to be formed first.

HSI

We can’t get the chart for the HSI out but after Fed’s meeting last week, we do see HSI following US with the selloff and with negative sentiments around we could still see HSI selling off a little more. Once again the sentiments has shifted and until we know how bad the fallout for the SVB is and how the CPI data next week is, any rebound will be met with short sellers. We did have some long positions when HSI pulled back and are we going to sell these? No! But we’re not adding more as yet till we see markets stablize a little more. No hurry for now.

As market is in a turmoil, head over to our Facebook for more updates on the US markets.

Stay safe and its the school holidays this week!

Yours

Humbly

Kelwin & Roy


The Week Ahead March 2023 – [STI, HSI, NASDAQ & S&P]

5th March, 2023, 2:58 PM

As per last week’s update, we mentioned that markets were due for a rebound after coming down so much. The S&P500 touched the 200ma and the 38% Fibo retracement level which gave support for a rebound! What to look out for this week? Fed Chair testifies this week, once again market will look to what he has to say and if there is a chance of less aggressive interest rate hike and less hawkish statements. This could then give rise to another leg up.

Another to note, towards the end of the week, the usual NFP and IJC will also take spotlight as to how inflation might be.

And lastly, China’s “Two Sessions” is an annual parliamentary meeting that gathers delegates from across China to discuss and approve national priorities. China is also set to release its annual targets for GDP growth, inflation and employment. The meeting could last about 2 weeks. What’s interesting is that China tends to gain after the NPC meeting. Are you positioned for that?


HSI


HSI came to our near term support and bounced off and even broke through the downtrend line which has been resisting it. Volume came in as short sellers looked to cover while long traders took the chance to build their positions. As we been advocating, take the downside for the HSI to add in your long term positions. With this break, we might see the index trend higher in the coming weeks. The hang seng index could still do a re-test of the lower band of 20,110 and then start to move up towards 21,353. Hope you have added some long term positions! Baidu, Tencent is leading the charge!

Watch out for the NPC meeting that is currently taking place too. It could give clues to which sector to be focusing on.

STI

STI was the only index that didn’t rebound, but we could be looking at some rebound this week as banks are also nearing their support. The immediate support for STI is at 3220 then 3181. We’re looking more for a rebound rather than shorting now. As banks make a big part of the STI, a move upwards could see it pull the STI up.

Its a big week ahead and things are looking up! Head over to our Facebook to read up more on the S&P500 and Nasdaq100. You don’t want to miss this.

Yours

Humbly

Kelwin & Roy

The Week Ahead Feb 2023 – [STI, HSI, NASDAQ & S&P]

26th February, 2023, 9:34 PM

As expected, we continue to see selling across global markets BUT with this pullback, its giving rise to some opportunity to enter the market.

Inflation data last week started to creep up and it spooked the markets with some selling. Some data coming out this week like initial jobless claim and Fed’s Waller will be speaking. Though not a very key speaker, but market will be listening in to see what the Fed’s stand is in the coming months. As market has seen selling for the past few weeks, we might see some rebounding coming in this week.

HSI

HSI has corrected about 12% since the high in Jan. A correction can be anywhere from 10-20% so don’t be surprised if we see further downside. BUT with such downside comes an opportunity to get back into the HK market especially investors missed out on the huge run in since Nov. The Spy balloon was the first cause that started this correction but at the same time could be a distraction The HSI might see a little more downside to around 19500 level before we see a rebound. This might not represent the bottom as yet and we’ll have to wait and see for it to be tested to ensure that’s the bottom. A rebound could take us back to 20k mark.  Eyeing Baidu, Tencent, Alibaba and a few others during this pullback.

STI

STI also came off to the level we anticipated with 3270 being a critical support. The main reason is that the banks have been experiencing selling after their results causing our STI to move down. We might see some rebound in the coming week but a better place to scale in might be at around 3220. There is a gap support over there and if it really doesn’t hold then 3180 could be the lower level we should see. Don’t miss this opportunity.

To know more about the levels to look out for in the S&P500 and Nasdaq100 do head over to our facebook for more details.

Yours

Humbly

Kelwin & Roy