SATS – [ Skies Are Opening Up! But Not Clear Skies Yet ]

21st October, 2020, 6:45 AM

SATS – [ Skies Are Opening Up! But Not Clear Skies Yet ]

Chart Source: Poemsview 21st Oct 2020

SATS has caught our attention since early Aug when covid cases started to stabilize and when it was trading at around $2.84. Talks were in place for travel to restart too. Singapore has been doing keep covid cases at bay with an average of 1-2 cases in the community which is  giving travelers some confidence. Phase 3 could be on the cards by year end too!

More good news as Singapore is firming up talks on travel to HK while SIA is also opening up its non-stop flight to NYC. More flights are opening up to Australia too. Cruise to nowhere is also starting next month and all these restarts are good for the badly beaten SATS. Yes, travel demand is not going through the roof yet, but countries are taking the right steps in trying to open their tourism industry.

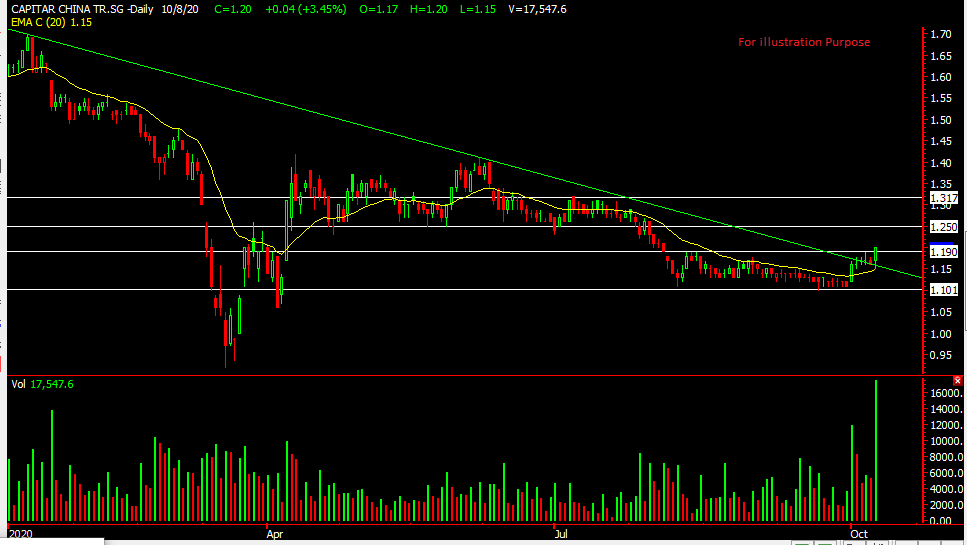
From a technical perspective, Sats is currently above the 100ema which it hasn’t cross in awhile so this is a positive sign to us. It recently tested this support which is also the downtrend line which we drew which showed strength and could bounce back up. Immediate resistance we see is at $3.14-3.15 once that is cleared we might even it challenge the 200ema in the coming weeks.

Keeping a close watch on SATS

Yours

Humbly

Kelwin&Roy

Follow and like us:

ISDN – [ Broke Out? Can It Move Up Further? ]

20th October, 2020, 1:16 PM

ISDN – [ Broke Out? Can It Move Up Further? ]ISDN 20th oct 2020

Chart source: Poemsview 20th oct 2020

ISDN looking good as it has broken above its horizontal resistance of $0.415 with some volume.

Could it stage more upside? It tested the $0.415 resistance just a few days back but failed to break it. From a technical analysis point of view, today seems a little different as it gapped up came back down to test the support and is back up now. If it manages to stay above this resistance turn support we might see more upside.

We have drawn the support and resistance levels for ISDN, keeping a lookout! Don’t forget election is around the corner. So always have a trade plan!

Yours

Humbly

Kelwin&roy

Follow and like us:

Sembcorp Industries – [ Bucking The Overall Trend Today, More Possible Upside? ]

15th October, 2020, 5:26 PM

Sembcorp Industries – [ Bucking The Overall Trend Today, More Possible Upside? ]


Chart Source: Poemsview 15th Oct 2020

Sembcorp Industries one of the rare few counter that buck the downtrend and closed positive. In fact, it’s the highest percentage gain within the STI component for today.

We’re glad we managed to catch Sembcorp Industries just before it broke out alerting our EXCLUSIVE CLIENTS on Monday when it was trading at $1.34. A nice 10 cents upside which is about 7.5% in a week is a good trade to us! Could Sembcorp Industries continue its run? We think it might be possible given that its strong in a weak market, there is volume coming in and it closed above the $1.40 horizontal resistance.

Our next possible upside is $1.47. But do be cautious, elections is in about 3 weeks, so things could start to get volatile again.

Want to cut through the noise and get such trade alerts straight to your handphone?

Then be our EXCLUSIVE CLIENT and find out how much value is waiting for you!

See you onboard soon!

Yours

Humbly

Kelwin&Roy

Follow and like us:

Medtecs – [ Let’s Analyze What Happened Today, Did You Get Trapped ? ]

14th October, 2020, 6:37 PM

Medtecs – [ Let’s Analyze What Happened Today, Did You Get Trapped ? ]Medtecs 14th Oct 2020

Chart Source: Poemsview 14th Oct 2020

Medtecs released a blockbuster results last night which made a lot of traders excited awaiting the opening this morning.  Net profit was up 111,466% which might make everyone rush in this morning. True enough retailers tried to join in the ride in the morning which looks promising until medtecs came close to the resistance of $1.60. From then, it got sold down rather quickly. Medtecs closed 8% down which might seem a little odd for such an impressive results?

Let’s analyze a little deeper and see what we can learn in order to avoid such a situation in future.

  1. Price ran before results. From the chart, we can see that medtecs started to run monday ahead of its results. Looks like a case of selling on results. Like buy on rumors and sell on news. It is understandable that traders were scared to miss out and wanted to get in at whatever price.
  2. Were traders expecting good results already? It is not much of a surprise that glove makers, PPE/mask makers would be reporting a good set of results.
  3. Take note of resistance too. Just because they reported a good set of results, it’s still important to watch out for resistance.

It is also always good to seek a second opinion if you’re unsure and we’re glad to share our two cents worth. We’re glad we didn’t chase this trade and shared with our clients regarding this trade. Also buying ahead of results is always a gamble as results could swing both ways and also if market had already priced in the expected good results. We don’t really advocate holding for results unless you are very aware of the risk.

Let’s look at Medtec from a technical perspective. It is still above the short term uptrend line, the resistance is around $1.60. First Support at the 5ema then $1.20 at the uptrend line which is also the 50ema.

Need an extra pair of eyes during market hours?

Just drop us a msg and you’ll get back to your shortly.

Yours

Humbly

Kelwin&Roy


Follow and like us:

Frencken – [ What’s Our Next Target? $1.10 Possible? ]

14th October, 2020, 6:50 AM

Frencken – [ What’s Our Next Target? $1.10 Possible? ]Frencken 14th Oct 2020


Chart Source: Poemsview 14th oct 2020

Frencken has seen a nice upside in the recent week after it broke above its 20ema. We’re glad we managed to alert our EXCLUSIVE CLIENTS when it was trading at $0.98. It moved up after but didn’t move  as much as expected but as we waited our patience paid off.  A nice 10% upside in two weeks is good to us as we continue to value add to our clients.

So what’s next for frencken? Will it be able to hit $1.10? Using technical analysis $1.10 is within grasp but we would prefer to take some profits off the table as some pullback and consolidation might be possible before it gathers strength to test $1.10 and maybe even $1.14!

Want to cut through the noise and get such trade alerts straight to your handphone?

Then be our EXCLUSIVE CLIENT and find out how much value is waiting for you!

See you onboard soon!

Yours

Humbly

Kelwin&Roy


Follow and like us:

Ascendas Reit – [ What Has It Broken Out From? ]

13th October, 2020, 5:10 PM

Ascendas Reit – [ What Has It Broken Out From? ]

Ascendas Reit 13th Oct 2020

Chart Source: Poemsview 13th Oct 2020

Ascendas Reit is a business space and industrial reit which i’m sure many would have seen their spaces all over Singapore. It is also part of the STI component. The Singapore portfolio includes Business and Science parks, High specs industrial & Data Centres. In 2019  ,Ascendas REIT acquired 28 business park properties in three growing US tech-cities. High-specs industrial and data centres make up 17% of its portfolio; with ICT customers contributing 9%, and data centres contributing 5%, to its monthly gross revenue. Data centres like we mentioned in our previous post of Keppel DC Reit is a hot asset in the market. Though Asecndas Reit is not a direct play its good to have a mix of it.

It’s dividend yield is around 4.9% which is decent. So let’s look at it from a technical analysis perspective.

It has broken above its 20 and 50ema which is a positive sign. If you look back, these two moving averages as been acting as the resistance and finally today it managed to break above it. Volume came in too as we can see it’s higher than the last few days. These are positive signs to us.

We have drawn some of the support and resistance level and we might see $3.40 in the coming weeks.

Keep a close watch!

Yours

Humbly

Kelwin&Roy


Follow and like us:

Keppel DC Reit – [ What Are The Chances Of Testing Previous High? ]

13th October, 2020, 7:07 AM

Keppel DC Reit – [ What Are The Chances Of Testing Previous High? ]Keppel DC Reit 13th Oct 2020

Poemsview : 13th Oct 2020

Keppel DC Reit is an unique asset class on its own and it’s the first pure-play data centre REIT listed in Asia on SGX.

Data centre has been a hot asset and keppel DC Reit has been a beneficiary of it.

From a dividend yield Keppel DC Reit isn’t that attractive of around 2.5% due to the vast increase in price but due to its strong name and financial standing it might be still worth looking at it.

From a technical point of view, it could be in a range with support being at $2.87and the upper limit at $3.07. It has stayed above the 20ema which is a positive sign. What would be good is that the volume could have been more which could indicate a sustained uptrend. Nonetheless, we think Keppel DC Reit stands a good chance to test $3.07 in the near future. It consolidated for the last two weeks and a push to $3.07 could be on the cards. Would prefer a swing for this counter.

Let’s keep a close watch!

Yours

Humbly

Kelwin&Roy


Follow and like us:

Capitaland Retail China Trust – [ Moved Up 6.5% After Our Post, Still Worth Looking At It? ]

12th October, 2020, 7:00 AM

Capitaland Retail China Trust – [ Moved Up 6.5% After Our Post, Still Worth Looking At It? ] CapitaR China Tr 12th Oct 2020

Chart Source : Poemsview 12th Oct 2020

If you read our blog just last friday we mentioned CaptaR China Tr was a stock that we’re looking at given their new investment strategy and a good dividend yield with a strong sponsor.

Well, just within the day it shot up over 6.5% to reach a day high of $1.28 from the previous day close of $1.20. It’s pretty impressive if you ask us, given that its a reit and we wouldn’t expect to see such a spike up.

So some have been asking, can still buy?? Fundamentally nothing changed overnight and the company is still on track with their expansion so let’s take a look of it from a technical perspective.

CapitaR China Tr has broken out of its downtrend line with a healthy volume and is moving away from that. If you missed this breakout then maybe for a retracement might be an idea. A good retracement might be the test of $1.20 where one can look for some entry again.

There could be more upside room for CapitaR China Tr and you got to ask yourself if you’re comfortable with chasing the stock now.We have drawn the resistance

Our upside target are drawn on the chart and we’re intending for this is to a midterm trade rather than a short term trade.

Don’t forget to subscribe to our blog or you can be our client and be informed of any latest updates.

Yours

Humbly

Kelwin&Roy

Follow and like us:

Capitaland Retail China Trust – [ Expansion Of Investment Strategy, Worth Looking At It?]

9th October, 2020, 7:00 AM

Capitaland Retail China Trust – [ Expansion Of Investment Strategy, Worth Looking At It?]

Image: CapitaR China Tr presentation slides

Capitaland Retail China Trust or CapitaR China Tr for short is the first and largest China-focused Reit listed in Singapore. They have recently announced an expansion of investment strategy which is turning some heads.

Just a snapshot of what they’ll be doing, they’ll be looking into its investment strategy beyond the retail sector to include office and industrial assets (including business parks, logistics facilities, data centres and integrated developments.) With key focus on long term growth, diversification, resilience, sustainability and returns.

This also shifts its focus from a pure retail play to a more diversified China growth story and might be more attractive for investors, given retail is on a decline and online shopping is gaining strong momentum.

Furthermore data centre are a unique asset and moving into this class of asset is in the right step.

An insert from CapitaR China Tr’s presentation.

More of the presentation slides can be viewed HERE

Let’s take a look at the chart and look at it from a technical analysis perspective.

Chart Source: Poemsview 9th Oct 2020

CapitaR China Tr has actually broken out of its long term downtrend line with one of the biggest volume for the year. It has also broken above its horizontal resistance of $1.19. These are positive technical points for an entry.

It has been consolidating for about two months and so some upside might be expected. We have drawn the resistance levels and a good support should be around $1.10

Our concluding thoughts :

1. Its operating metrics turned positive in Aug and with recovery in sight, we might see more upside

2. Potential addressable pipeline close to $33bn  (from its sponsor CapitaLand)

3. Dividend yield of about 6% which is very decent in today’s market

4. Worth a look for your investment/dividend portfolio with a structured approach in scaling in.

Do contact us if you’ll like to know more!

Yours

Humbly

Kelwin&roy


Follow and like us:

Capitaland – [ Rebounding Off The Bottom, How Far More Can It Go? ]

6th October, 2020, 3:45 PM

Capitaland – [ Rebounding Off The Bottom, How Far More Can It Go? ]Capitaland 6th oct 2020


Chart Source: Poemsview 6th Oct 2020

Capitaland part of the STI component stock had a nice rebound ever since we mentioned about its base building just last week. It has reached our target of $2.80 in less than a week and experienced some pullback after hitting the resistance. Property counters are generally lagging behind but with strong sales, could these counters start to pick up?

Using technical analysis, for now 2.80 shall be the resistance and if Capitaland can break that we might see it move higher to around $2.86-2.88 which is the 100ema and the horizontal resistance.

Don’t forget to follow us on Investingnote as we do post there frequently too.

Yours

Humbly

Kelwin&roy

Follow and like us: