HKEX (388.HK) – [Is The Sell Off Over?]

17th March, 2021, 7:15 AM

HKEX (388.HK) – [Is The Sell Off Over?] HKEX(388.HK) 17th March 2021

Chart Source: Poemsview 17th March 2021

The Hong Kong Stock Exchange is the exchange base in Hong Kong and its the world’s largest bourse in terms of market capitalization surpassing Chicago-based CME. As of end 2020, it has 2,538 listed companies with a combined market capitalization of HK$47 trillion. It is also one of the fastest growing stock exchanges in Asia.

This stock exchange is owned by the Hong Kong Exchanges and Clearing Limited ( 388.hk). The Hong Kong Government is the single largest shareholder in HKEX, and has the right to appoint six of the thirteen directors to the board.

Just a while back Hong Kong’s government increased its stamp duty on equity transactions on the city’s stock exchange for the first time in almost three decades which caused a knee jerk reaction despite posting three straight years of record profit.

Now, is the selling done? Has the selling been a bit too much?

Lets take a look from a technical perspective. 

HKSE(388.HK) has corrected about 26% from its peak and its a healthy correction to us. It has found some support at around HK$437 and its starting to build a base around there. The 5ema is current its immediate resistance . It tried to break that yesterday but didn’t managed to. A break above that might see a test to the 10eam then the 20ema of around $476. For long term investors, this might present a good opportunity to scale in at this level. The next support we might see is around $415 if the horizontal support doesn’t hold. The mid term upside target might be $508.

Will update more as time goes by. We’re bullish on HKSE in the longer run and such a fall present us with a good chance to scale in.

Yours

Humbly

Kelwin&Roy
Capitaland – [ Recovery Play, Broke Out, Where Next? ]

16th March, 2021, 7:33 PM

Capitaland – [ Recovery Play, Broke Out, Where Next? ]Capitaland 16th March 2021

Chart Source: Poemsview 16th March 2021

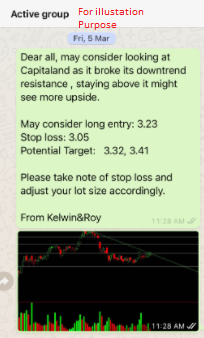
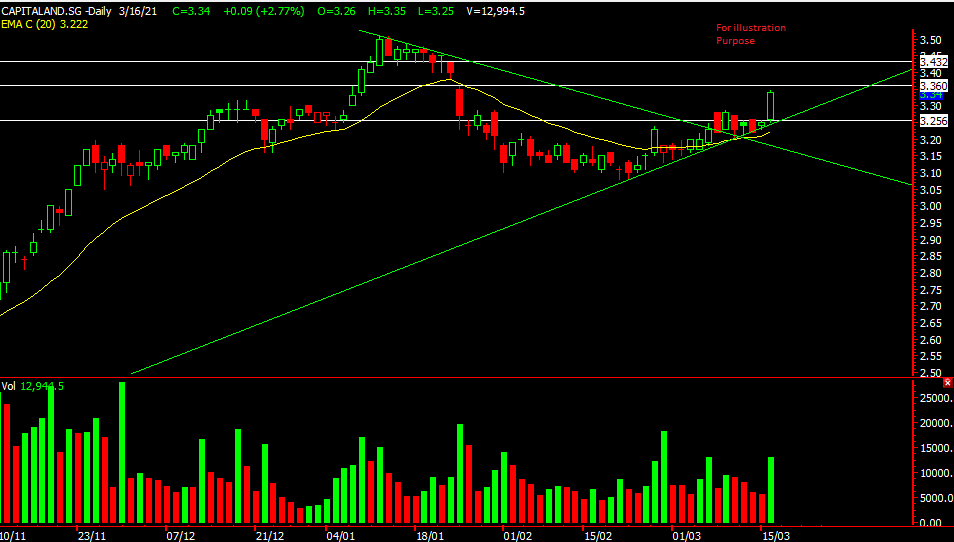
Capitaland saw a nice push in its price as the recovery theme continues to be in play. Even some reits saw a rebound in their prices. It was about a week ago when Capitaland caught our eyes as it started to break above its downtrend resistance line. Upon this break, we alerted our EXCLUSIVE CLIENTS and soon enough Capitaland started its move. Another stock hongkong land had made a move earlier on and now its Capitaland’s turn!

It has hit our first target of $3.32 with a short term resistance of around $3.36 and then our second target of $3.41.

Volume also started to increase which could help sustain this rebound to our targets.

Want to position yourself before a potential move?

Want to cut through the noise and get such trade alerts straight to your handphone?

Then be our EXCLUSIVE CLIENT and find out how much value is waiting for you!

See you onboard soon!

Yours

Humbly

Kelwin&Roy

SATS – [ Recovery In Sight, Able To Break the $4.54 Resistance? ]

15th March, 2021, 7:38 PM

SATS – [ Recovery In Sight, Able To Break the $4.54 Resistance? ]Sats 15th March 2021

Chart Source: Poemsview 15th March 2021

Just less than a week ago, we spotted SATS sitting nicely on its 20ema support and with the recovery theme in the background we decided to alert our EXCLUSIVE CLIENTS when it was trading at $4.38. SATS together with SIA saw a nice recovery in their stock price as more good news about reopening air travel starts to make its way around. Vaccine rollout is moving on and with that, government around the world are planning to see how to have travel bubbles or vaccine passport so that leisure travel can restart.

With that, SATS looks like its in a good position to capture the recovery but it might not be a fast and strong one as countries around the world has to be on equally vaccine footing before anything major can really happen. From the chart, SATS looks likely to break the previous peak of $4.54 which it tested today and is also our second target. Volume also started to come in.

A break above $4.54 might see our third target of around $4.67!

Want to cut through the noise and get such trade alerts straight to your handphone?

Then be our EXCLUSIVE CLIENT and find out how much value is waiting for you!

See you onboard soon!

Yours

Humbly

Kelwin&Roy


UMS – [Rebound In Progress, Some Of Our Targets ]

11th March, 2021, 9:45 PM

UMS – [Rebound In Progress, Some Of Our Targets ]UMS 11th March 2021

Chart source: Poemsview 11th March 2021

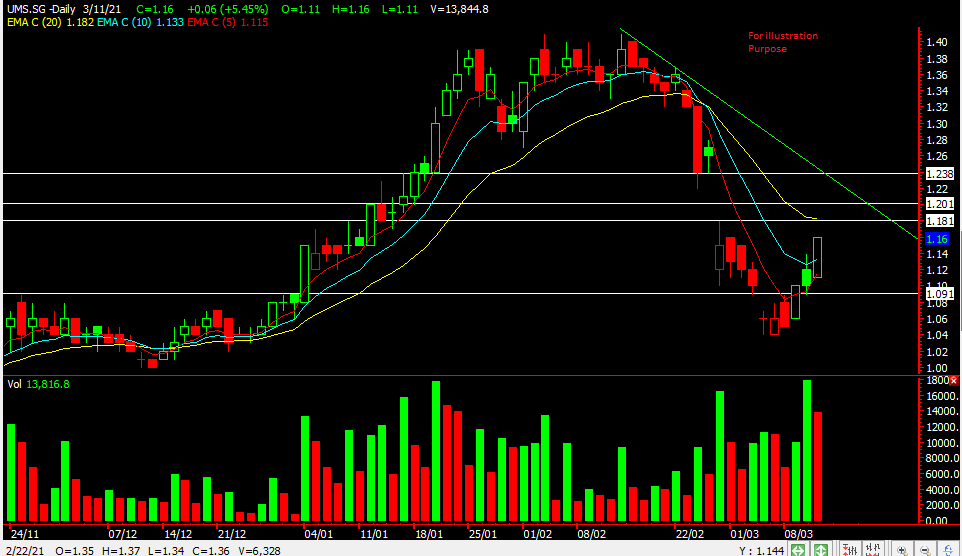
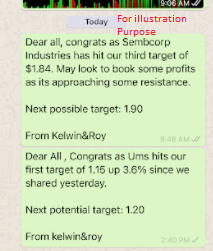
UMS saw a nice rebound today hitting our first target of $1.15. A bullish closing today at the day high might signal more upside to come. Potential gap resistance at $1.18 first and then our next target of $1.20. Electronic stocks have been oversold despite posting results in line with analyst. So a rebound to cover the gap to around $1.24 might be reasonable. Keeping our fingers crossed.

Will update more on AEM as it has rebounded too from our previous post

Want to cut through the noise and get such trade alerts straight to your handphone?

Then be our EXCLUSIVE CLIENT and find out how much value is waiting for you!

See you onboard soon!

Yours

Humbly

Kelwin&Roy

AEM – Is A Rebound Insight? When Will The Selling End?

9th March, 2021, 7:27 AM

AEM – Is A Rebound Insight? When Will The Selling End? AEM 9th March 2021

Chart Source: Poemsview 9th March 2021

AEM has recently been sold down over 20% when funds started to shift out to more value stocks. Despite research reports maintaining a buy on AEM, AEM continues to sell down causing investors to think twice about touching it.

Lets look a little closer at AEM and its recent results. Its FY20 revenue/net profit was in line with consensus. Balance sheet remains in a net cash position. It announced another acquisition to strengthen its system level test capabilities.

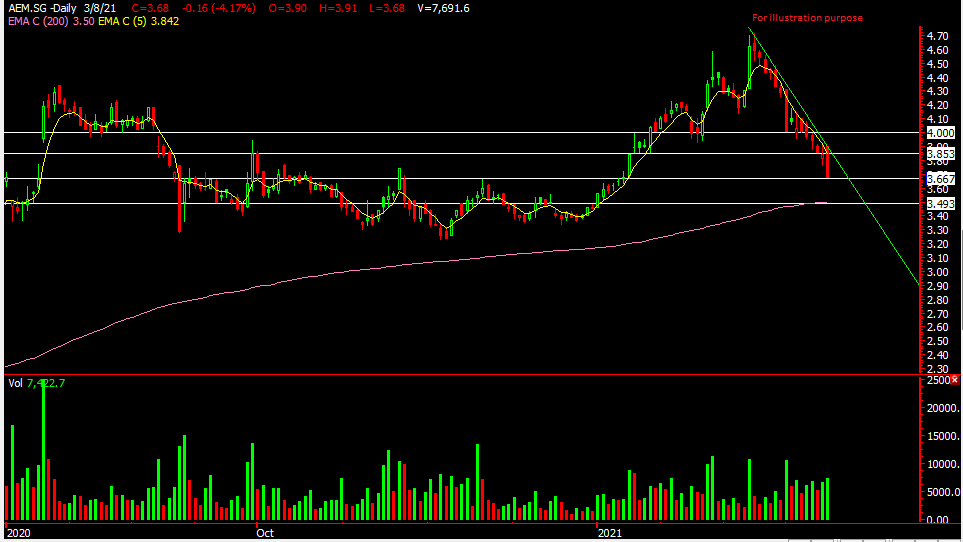
And now lets take a look at the technical chart. AEM has corrected about 20% sine the peak. A horizontal support of around $3.66 might provide some support and our next support might be around the 200ema of around $3.50. A rebound might be in sight after such a fall as bargain hunters are on the lookout at current price. A nimble bite at this current price is what some investors might consider doing. As for traders, we’re looking for a bullish candle off the support level or even a break above the 5ema (highlighted by the yellow line) before an entry. As we can see, the 5ema as been acting as the resistance and so far AEM cannot break through that.

What are your thoughts? Will AEM continue to fall even more? Lets us know!

Yours

Humbly

Kelwin&Roy

Straits Times Index – [ In The Midst Of A Pullback And Here’s What We Did Last Week!]

29th January, 2021, 7:14 AM

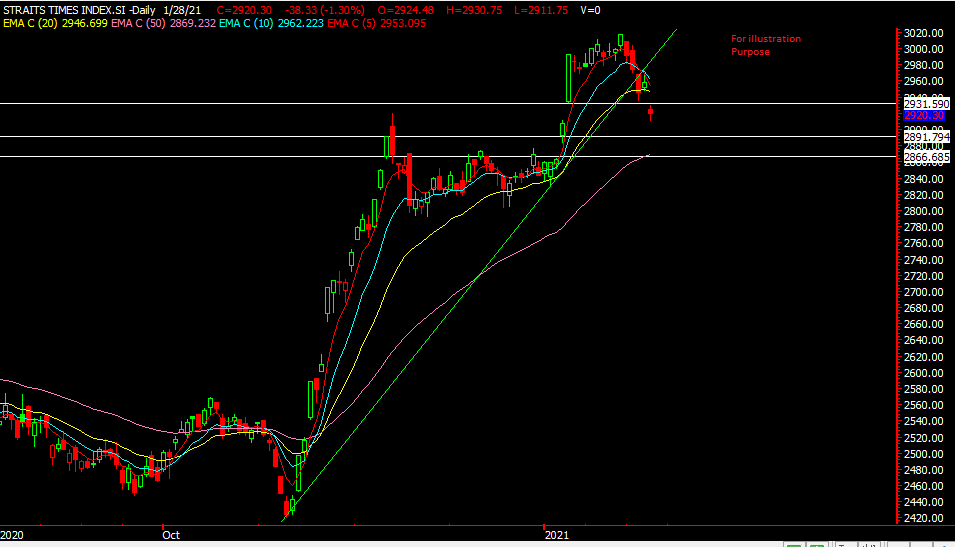
Straits Times Index – [ In The Midst Of A Pullback And Here’s What We Did Last Week!] Straits Times Index 29th Jan 2021

Chart Source: Poemsview 29th Jan 2021

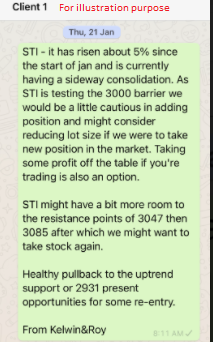
Straits Times Index currently having a pullback from a high 3017 which might have come as a surprise for some but we’re thankful that our EXCLUSIVE CLIENTS were warned of this pullback last week. STI had moved up over 5% since the start of Jan and along with other  markets it looked tired and was tough to push higher. True enough some pullback came which is healthy in our view.

We have drawn some support levels for the STI with the 50ema of around 2866 being our major support. Support levels might present chance to scale in for long term stocks.

Want to have such updates sent to your handphone straight?

Then be our EXCLUSIVE CLIENT and find out how you can be included in our trading community.

See you onboard soon!

Yours

Humbly

Kelwin&Roy

Xiaomi (1810.HK) – [Will It Break From Its Downtrend Line? ]

26th January, 2021, 7:15 AM

Xiaomi (1810.HK) – [Will It Break From Its Downtrend Line? ]Xiaomi 26th Jan2021

Chart Source: Poemsview 26th Jan 2021

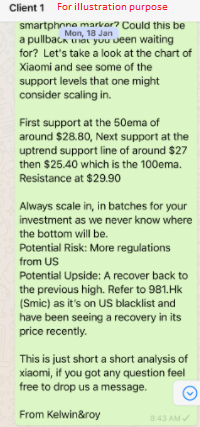
Xiaomi(1810.HK) has recently found itself in the US blacklist which bans Americans form investing in companies that are in this blacklist. Naturally on such news we saw xiaomi nosedive over 10% and as everyone panic we saw possible opportunities. So we sent out a message to our clients the next day informing them of some potential support points to look out for. After touching the 50ema Xiaomi did a 10% rebound which actually hit the downtrend line, a good profit for those short term traders.

So what is our trade plan now? Xiaomi is currently near the downtrend resistance line and a break above that might see more bullish action coming in which might take it to around $33.70 levels. If it breaks during the day and doesn’t close above the resistance then we would want to be more cautious as this might signal weakness.

For longer term investors, scaling in at support levels is a strategy we deploy and scaling in in batches too and not going all in at a time is also our preference. We have drawn some support levels so do take a look.

Want to have such updates sent to your handphone straight?

Then be our EXCLUSIVE CLIENT and find out how you can be included in our trading community.

See you onboard soon!

Yours

Humbly

Kelwin&Roy

Salesforce (CRM) – [Consolidating For A Move Up?]

25th January, 2021, 7:33 PM

Salesforce (CRM) – [Consolidating For A Move Up?]salesforce 25th Jan 2021

Chart Source: Poems2.0.com

Salesforce (CRM) is currently in a sideway consolidation for the past month or so. Using technical analysis, the horizontal resistance is around $233 and nearby short term downtrend line is around $236. So if these key levels are taken out we might see a push towards $250 or even higher in the mid term. Volume is also coming in

It has test the horizontal support of around $214 and started to bounce up. If market sentiments continue to remain strong we might see more bullish action from salesforce!

Keeping a look out for this counter!

Yours

Humbly

Kelwin&Roy

Paypal ( PYPL ) – [ Our Trade Plan ]

11th January, 2021, 7:36 PM

Paypal ( PYPL ) – [ Our Trade Plan ]Paypal 11th Jan2021

Chart source: poems2.0 11th Jan 2021

Paypal (PYPL) is the largest digital platform that provides money transfer services. PayPal boasts a consistent track record of earnings and sales growth, stretching back to at least 2010. PayPal has also gone into the cryptocurrency space battling it out with Square (Sq). The two payment companies are marketing apps that let shoppers get discounts, make installments and buy cryptocurrencies. These companies allow investors into a little space of the cryptocurrency.

Lets take a look at the chart and use some trendlines to help us. If PayPal manages to break above that horizontal resistance of around $244.30 and staying above that with volume we might see it move higher in the coming days. If it can’t then a then it looks a like little double top and a healthy retracement would be good too. The first support would be that uptrend support of around $234 then around $225. Buying at support would be more ideal but lets keep a close watch on it.

Yours

Humbly

Kelwin&Roy
IFast – [ Fast Recovery, Covered Gap, Can It Break The All Time High? ]

11th January, 2021, 6:47 PM

IFast – [ Fast Recovery, Covered Gap, Can It Break The All Time High? ]IFast 11th Jan 2021

Chart Source: Poemsview 11th Jan 2021

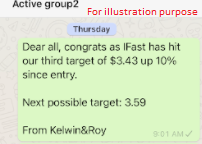
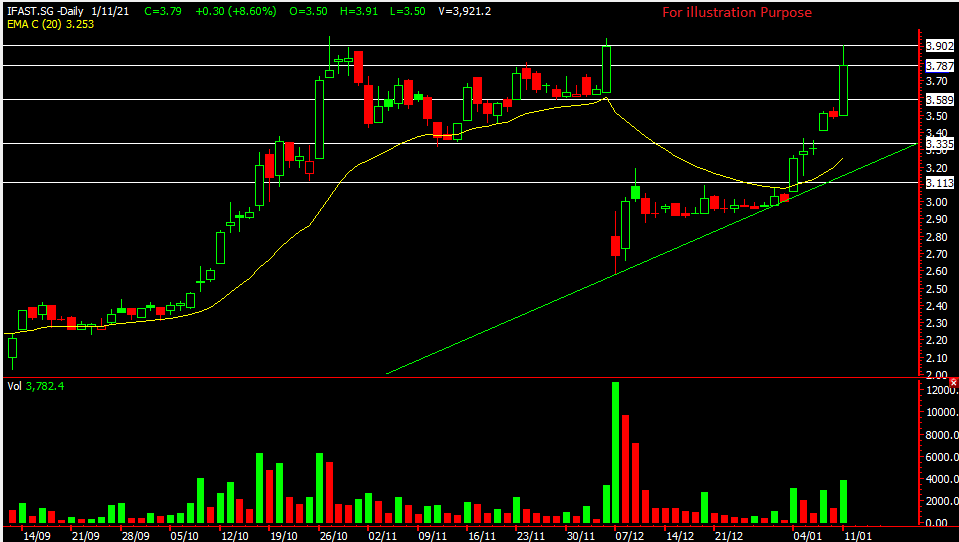
IFast’s share price has been on a road to recovery even though it didn’t managed to win the digital banking license. The massive selloff was unjustified as we mentioned in our previous blog post. Ever since then, IFast started to make a recovery and amazingly it recovered back close to its 4th Dec price just before the announcement was made.

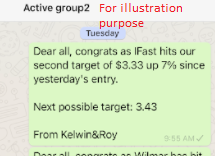
We’re glad we follow through this stock and informed clients of our new targets  along the way as you can see from the messages. IFast has risen 25% since our initial alert but is this the end of the road for IFast? Well, we received a research report from Jefferies which could be one of the reason for the fierce upside today.

Research report by jefferies. Report is not a buy or sell call.

Is the rebound over? We feel that a short break might be good as traders/investors who got in at the high previously might be wanting to sell out after a rollercoaster ride which could provide some resistance. Pullbacks to support might be a good re-entry if you missed the boat. The increased in volume today signed confidence for us and in the longer term we’re looking at IFast to move past the all time high. Fingers crossed!

Want to cut through the noise and get such trade alerts sent straight to your handphone? In addition, have such a detailed follow up?

Then be our EXCLUSIVE CLIENT and find out how much value is waiting for you!

See you onboard soon!

Yours

Humbly

Kelwin&Roy