Frencken – [ Surged In Volume Today, First Target Met, More Upside?]

24th October, 2019, 6:18 PM

Frencken – [ Surged In Volume Today, First Target Met, More Upside?]

Frencken 24th Oct 2019

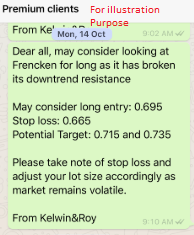
Chart Source: Poemsview 24th Oct 2019

Frencken finally saw some movement today as traders started to rotate over to Frencken. A huge surge in its volume today saw it hitting our first target of $0.715. As the excitement faded Frencken closed off at $0.71. With such huge volume it might help sustain the next up move.

Frencken has to break above 0.715  a potential resistance which might then take us to 0.735 then 0.745 its previous high. We’re glad we alerted our EXCLUSIVE CLIENTS on Frencken before it moved so that they could plan, prepare and proceed.

Want to be part of this EXCLUSIVE GROUP that were alerted of such a trade analysis?

Wait no more! CONTACT US NOW to see how you can be part of this group to receive value added service sent straight to your handphone.

Yours

Humbly

Kelwin&Roy


AEM – [ Up Over 10% In A Week Since Our Blog Post, Time To Be Cautious? ]

23rd October, 2019, 7:03 PM

AEM – [ Up Over 10% In A Week Since Our Blog Post, Time To Be Cautious? ]AEM 23rd Oct 2019

Chart Source: Poemsview 23rd Oct 2019

AEM continues its impressive rally moving up over 10% since our blog post. In our previous post just last week, we mentioned that we’re looking at AEM for it to break its strong resistance of $1.23 and true enough it did moving to $1.29 and even to a day high of $1.40.

From the chart we drew, AEM might be facing resistance very soon at around $1.42 level and it might be wise to book some profits and see how it goes after that. We’ll use the 5ema as a guide for further exit point.

We hope our readers managed to learn and capitalize on our explanation on our trading blog!

Contact Us if you would like to know more about AEM

Yours

Humbly

Kelwin&Roy

Straits Times Index – [ Following Up After First Target Met]

22nd October, 2019, 5:28 PM

Straits Times Index – [ Following Up After First Target Met] Straits Times Index 22nd Oct 2019

Chart Source: Poemsview 22nd Oct 2019

Straits Times Index saw a break away from its consolidation zone over the last week hitting our first resistance target of 3154 which we drew back on 13 Oct.

From our explanation in our previous post,  the Straits Times Index broke above our downtrend line we drew, it also broke above its 20ema which are positive signs for us.

Some possible scenarios for now, STI might cover the gap it created this morning and might continue its march up. It could also test today’s high again and a success break might see it move to 3188 area.

A break below the 20ema might cancel our upside view.

We hope our readers managed to learn and capitalize on our explanation on our trading blog!

Lets Watch it!

Yours

Humbly

Kelwin&Roy

AEM – [ Watching It Closely For The Break!]

15th October, 2019, 5:52 PM

AEM – [ Watching It Closely For The Break!]AEM 15th Oct 2019

Chart Source: Poemsview 15th Oct 2019

AEM one of Singapore’s electronic stock broke through its $1.16 horizontal resistance and continued to march up to another major resistance at $1.23.

Currently $1.23 is a strong horizontal resistance and is also at the upper trend line resistance. Watching for this break and ensuring it can stay above the resistance.

Next possible target might be $1.29 if a successful break is here.

Lets watch it!

Yours

Humbly

Kelwin&Roy

St Engineering – [ First Target Met In 2 Days, Top Gainer Today, More Updates!]

9th October, 2019, 8:10 PM

St Engineering – [ First Target Met In 2 Days, Top Gainer Today, More Updates!]
St Engineering 9th Oct 2019

Chart Source: Poemsview 9th Oct 2019

St Engineering part of the STI component was one of the rare few stocks that bucked the downtrend! It reached a day high of $4 before closing at $3.97. St Engineering saw a rise of over 2% since our blog post just Monday evening (2 days ago) and was top gainer for the day. In our previous post we explained some of the reasons why we were looking at it and we’re glad it went the way we wanted it to.

For now St engineering has met our first target of $3.99 a nice 2% upside in 2 days. Our next target if St engineering can stay above $3.99 might be $4.05 as it attacks the downtrend line again. Would it be able to break it? Stay TUNE!

Yours

Humbly

Kelwin&Roy

St Engineering – [ Worth Taking A Look? Here’s Why]

7th October, 2019, 5:38 PM

St Engineering – [ Worth Taking A Look? Here’s Why]St engineering 7th Oct 2019

Chart Source: Poemsview 7th Oct 2019

St Engineering might be a worth a second look as it had a flush recently. Is St engineering about to fall more or is there hope? Here are some reasons that we feel that a rebound might be coming.

  1. Volume today is more than previous day
  2. It managed to close above the 200ema
  3. It managed to close above 20ema which it failed to do so the previous time
  4. It also broke out of its short term downtrend line.

As such St engineering is in our watchlist for a rebound. Lets watch for a good entry!

Some of our past records of St engineering can be seen here! 

Yours

Humbly

Kelwin&Roy

Singpost – [ Posting Strong Gains , Time For A Break?]

24th September, 2019, 7:26 PM

Singpost – [ Posting Strong Gains , Time For A Break?]

Singpost 24th Sept 2019

Chart Source : Poemsview 24th Sept 2019

Singpost had a good three days run up moving up about 7%. We managed to catch it at 0.96 posting our thoughts on Investingnotes or IN for short.

Singpost is currently being resisted by the 200ema and that downtrend line which we drew. If it manage to break above that then we might see it move to $1.02. At this point it might be good for Singpost to take a break before carrying on its upwards move.

Don’t  forget to follow us on investingnotes for updates too.

Yours

Humbly

Kelwin&roy

SGX – [ Day Low of $8.27, Down 20cents In A Week Since Post]

23rd September, 2019, 5:08 PM

SGX – [ Day Low of $8.27, Down 20cents In A Week Since Post]SGX 23rd Sept 2019

Chart source:Poemsview 23rd July 2019

SGX hit a day low of $8.27 down 20 cents since we posted on 18 sept before market open. SGX is down over 2% in less than a week which is a nice gain for us.

We listed the various reason in our previous post for what we saw in SGX that might have led to the downside and will be going through them tonight.

SGX is currently under the 20ema and also under the short term uptrend line. Failing to stay above might see the next downside level to $8.16. Let’s watch it.

See all those who have signed up tonight!

Yours

Humbly

Kelwin&Roy

Hi-P – [ Any Higher? ]

18th September, 2019, 12:32 PM

Hi-P – [ Any Higher? ]Hi-P 18th Sept 2019

Chart Source: Poemsview 18th Sept 2019

Hi-P has been consolidating for awhile at the base of around $1.10 and it slowly moved up to break its 10ema. After spotting that ,we decided to inform our EXCLUSIVE CLIENTS of the move for them to plan, prepare and proceed.

As the 10ema has been resisting it and finally a break above it, it signaled a good turn for us and hence our decision. Volume also started to come on that day.

Hi-P took about 5 days to reach our second target of $1.23 which saw a nice 7% upside since our entry of $1.15. If one were to do contra trading he or she might miss out on the second target that is why using CFD might help to overcome this problem.

Currently has Hi-P faces resistance at the 50ema and also the downtrend line we might consider taking profits as Fed decision looms too. Might look for a re-entry after that! Stay tune.

On 23rd Sept we’ll be revealing to you one of our trade secret on using the moving average and how to use CFD to swing your trades and avoid overtrading .

Date: 23rd Sept

Time : 7:30-9:30pm

Registration is a must and can be done via the link below

https://www.eventbrite.sg/e/continuation-of-trade-wars-how-to-use-cfd-moving-average-to-manage-current-volatile-market-tickets-72254205273

See you there

Yours

Humbly

Kelwin&Roy

Keppel Corp – [ Up 6% After Saudi Oil Field Attack, More Upside Or Take Profit?]

16th September, 2019, 5:47 PM

Keppel Corp – [ Up 6% After Saudi Oil Field Attack, More Upside Or Take Profit?]Keppel Corp 16th Sept 2019

Chart Source : poemsview 16th Sept 2019

Keppel Corp gapped up this morning to an intra day high of $6.35 surpassing our third target of $6.32!

Keppel Corp surged up due to the attacks on the Saudi oil field which saw crude oil surging over 10%! We hope our readers didn’t chase this breakout which might be a little on the high side for now.

We’re glad that we alerted our EXCLUSIVE CLIENTS just about a week ago when Keppel Corp managed to break above its 20ema which was a rare occurrence  for the last two months. From then on, Keppel Corp started its gradual climb which saw a nice upside of 6% since our alert at $5.96! It might be good to take some profit off the table as it has moved up over 8 days so some profit taking shouldn’t be too unreasonable.

Our next target might be around $6.48 after some profit taking which might make Keppel Corp more attractive again.

Want to know how to use the moving average to your advantage?

Want to learn how to use the moving average as a guide for your entry? Then the upcoming seminar on 23rd Sept is for you!

On 23rd Sept we’ll be revealing to you one of our trade secret and how to use the moving average as a guide for your entry. In the next few post, we shall see how it has been useful for us to time an entry.

Date: 23rd Sept

Time : 7:30-9:30pm

Registration is a must and can be done via the link below

https://www.eventbrite.sg/e/continuation-of-trade-wars-how-to-use-cfd-moving-average-to-manage-current-volatile-market-tickets-72254205273

See you there

Yours

Humbly

Kelwin&Roy