Wilmar – [$5 In Sight? ]

23rd March, 2022, 2:19 PM

Wilmar – [$5 In Sight? ]

Wilmar broke out of its $4.77 horizontal resistance line and moved up further. We’re seeing a re-test of this resistance turn support and if it manages to hold steady, we might see Wilmar testing the round number resistance of $5. There was a huge volume increase yesterday and with today’s pullback on lighter volume is considered healthy to us.

Wilmar has been a counter we’ve been eyeing since 2 months ago in Feb was it was just trading at $4.43. It has since then moved up over 10% and might be looking to challenge the $5 resistance which more profit taking might come in. Looking out for that!

Want to be alerted earlier before the breakout?

Want to know what stock we’re looking at next?

Be our EXCLUSIVE CLIENT and be alerted earlier to not miss out!

Yours

Humbly

Kelwin&Roy
First Resources – [ Commodities Boom, First Thing To Do Now]

3rd March, 2022, 7:23 PM

First Resources – [ Commodities Boom, First Thing To Do Now]

Chart Source: AdvisorX 3rd march 2022

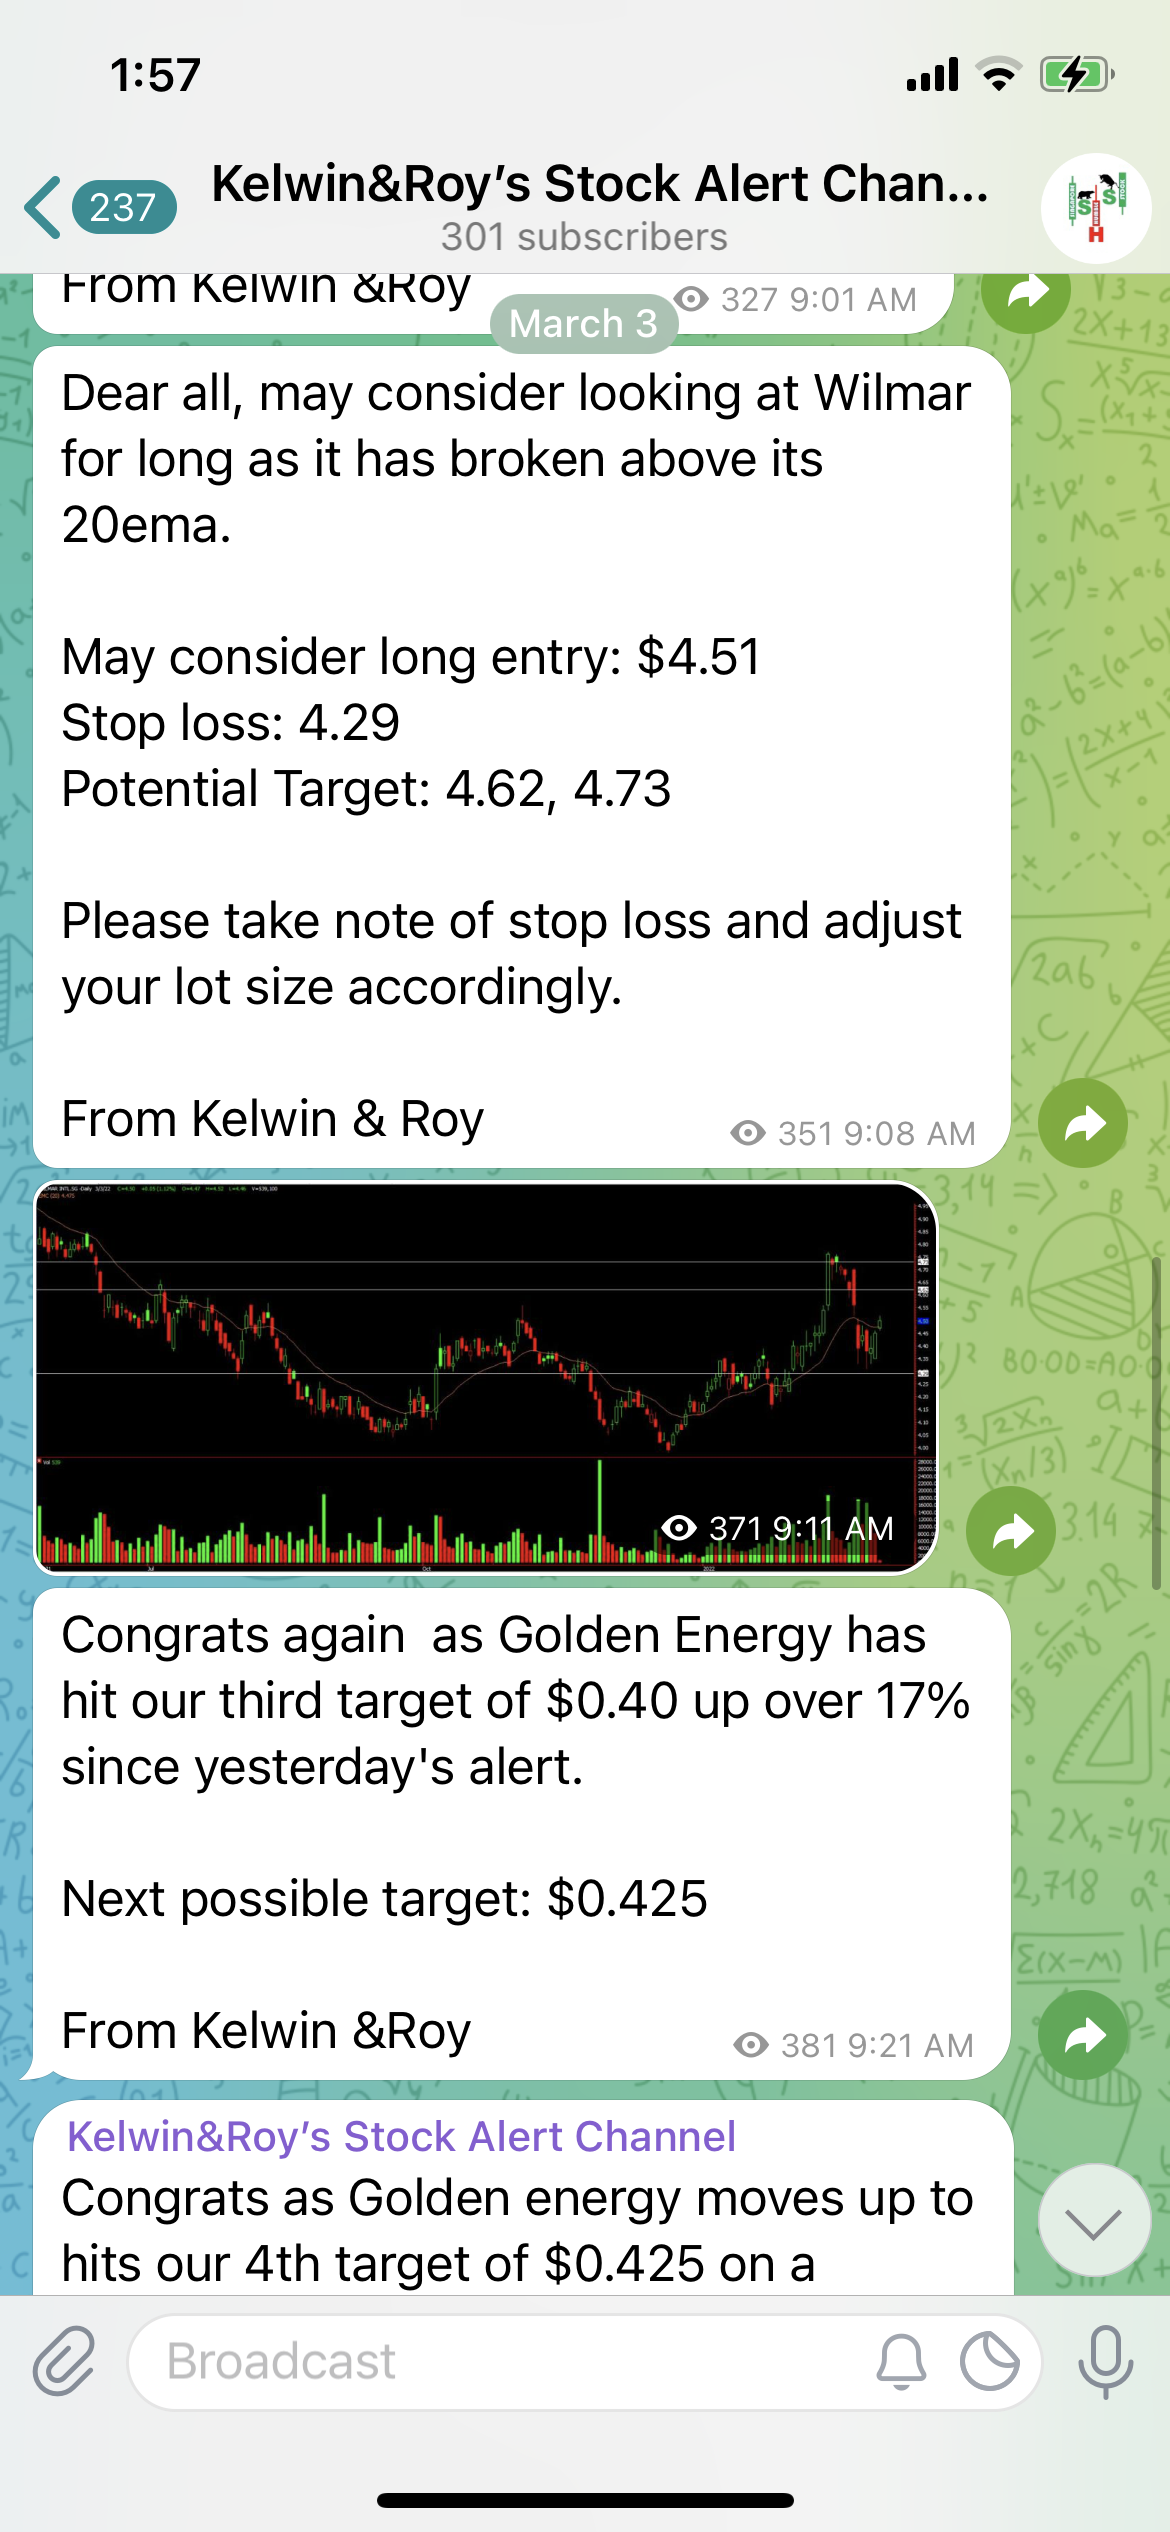
As the commodity boom continues, palm counters counters continue their rally. Due to the fighting in Ukraine, this has given the rally more legs as disruption, shortages and sanctions send prices rocketing. As prices move up and traders get excited, there is one thing to do before entering a trade.

Don’t get carried away with soaring prices and chase without any trade plan. It is always very dangerous to just  enter a trade purely on momentum and without any proper entry and stop loss as profit taking could happen any time.

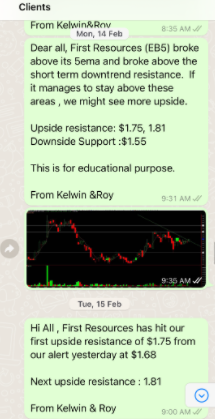
Remember to look out for potential support and resistance and not to enter at the resistance without realizing it. We have drawn some of the support and resistance for first resources but of course if you’re like our clients who have been informed 2 weeks ago when First Resources was at $1.68 then this might be a place to take some profit.

First Resources has hit multiple upside targets moving up 20% which is very good in our view. So taking some profit now would probably be a wise thing. As the commodities continue to move up in the long run, remember to define your time horizonal.

Want to be alerted earlier before the breakout?

Want to know what stock we’re looking at next?

Be our EXCLUSIVE CLIENT and be alerted earlier to not miss out!

Yours

Humbly

Kelwin&Roy
AEM – [ Aiming To Break Previous High? Riding On The Good News]

31st August, 2021, 7:41 PM

AEM – [ Aiming To Break Previous High? Riding On The Good News]AEM 31st Aug 2021

Chart source: AdvisorXs 31st Aug 2021

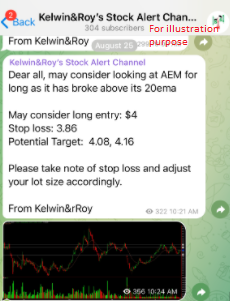
Just a week ago we spotted AEM having some movement as it managed to cross its 20ema at $4. It started to slowly make its way up and as Nasdaq continue to make new high and some positive sentiments flowed over to our electronic stocks. But what probably led the charge was the news released during lunch time when AEM was chosen by Major memory IDM company for its system level test (SLT) provider. Good thing was that we didn’t need to chase after the stock as we were well positioned for any potential move!

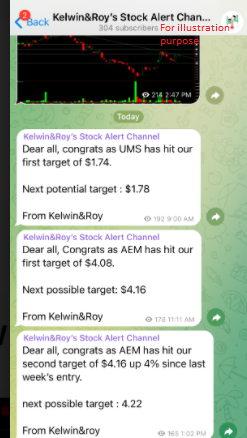
That gave a good boost to AEM  helping it hit our second target of $4.16. Volume came in and we might see our third target of $4.22 hitting in the coming trading days. Some profit taking might come in soon too.

Its the end of Aug and its been quite a month as we celebrated Singapore’s birthday and also a new milestone as we shared over 15 trade alerts this month to our EXCLUSIVE CLIENTS!

Want to be alerted of such potential entry?

Be our EXCLUSIVE CLIENT and find out how to be included in our growing community.

Yours

Humbly

Kelwin&Roy


Straits Times Index – [The Road Ahead]

30th August, 2021, 7:00 AM

Straits Times Index – [The Road Ahead]Straits Times Index 30th Aug 2021

Chart Source: AdvisorXs 30th Aug 2021

Familiar with the NDP theme song the road ahead by now?  Such a hit and very relatable as Sinagporeans navigate through the road ahead with courage and determination.

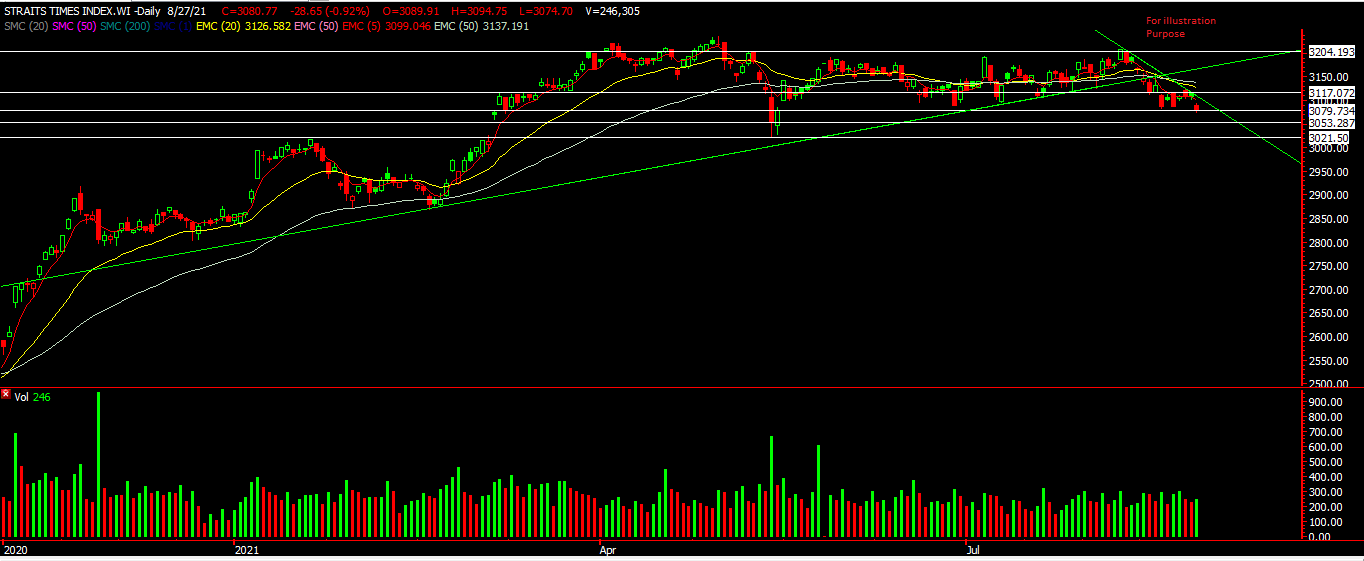
So what’s the road ahead like for our Straits Times Index? Is is choppy? Or is it a smooth ride ahead?  Well, lets take a look at the chart to get some idea. From a technical analysis perspective, STI is currently sitting on its horizontal support of around 3080 level. This coincides with the support of around March but if this support doesn’t hold we might see a further leg down to 3050 and if weakness persist, 3020 is the area of the previous gap cover. 3020 would be a key support for us but we’re hoping it doesn’t go there.  For the upside, STI has to break our downtrend line first as a first sign of strength and also the 5ema of around 3100. That would signal strength and as Fed gets the market ready for its bond tapering this year, we are keeping track to see how other market reacts as the sentiments will flow over to Asia. Some upside resistance might be around 3120 then 3160 and 3200.

The road ahead might not be easy but with an extra pair of eyes, the journey need not be so arduous.

Want a pair of remisiers to help guide and guard against pitfalls? Or even receiving timely trading alerts on potential stocks?

Drop us a message to see how you can be included in our growing trading community.

Yours

Humbly

Kelwin&Roy

Aztech – [Bottomed Out? Potential Rebound?]

24th August, 2021, 7:31 PM

Aztech – [Bottomed Out? Potential Rebound?]Aztech 24th Aug 2021

Chart Source: AdvisorXs 24th Aug 2021

Aztech one of Singapore’s leading design and electronics manufacturer. Its equipped with state-of-the-art equipment, driven by 4 R&D centres, with expertise in design, manufacturing and packaging to deliver a seamless, unified experience. Each and every time.

It recently reported a good set of results but despite that its price came down due to analysts remaining cautious amid operational risks arising from component shortages. Local brokerage houses has lowered their target price to an average of $1.78. The current price looks depressed as its down 30% since the high of $1.56.

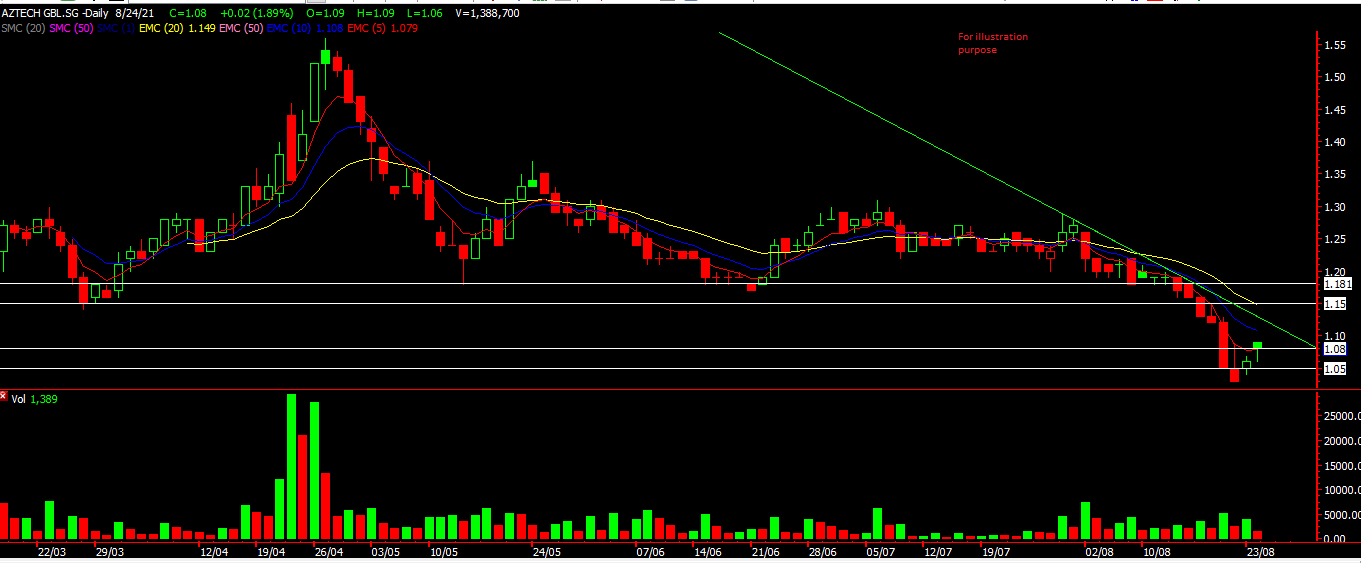
Taking a look at the chart and from a technical analysis perspective, $1 would be a good psychological support and a good level to scale in or look for a trade. But what’s interesting for now is that it broke the $1.05 support, had a fake breakdown but recovered over the last few days. Interesting set up if you ask us. A good rebound might be seen over the couple of days if $1.05 manages to hold and the volume yesterday was also promising. Some upside resistance might be $1.15 then $1.18. Some resistance also could be at that downtrend resistance line.

Keeping a lookout for Aztech.

Yours

Humbly

Kelwin&Roy


Nanofilm- [ First Upside Resistance Hit Among All The Noise]

23rd August, 2021, 7:49 PM

Nanofilm- [ First Upside Resistance Hit Among All The Noise]Nanofilm 23rd aug 2021

Chart Source: AdvisorXs 23rd aug 2021

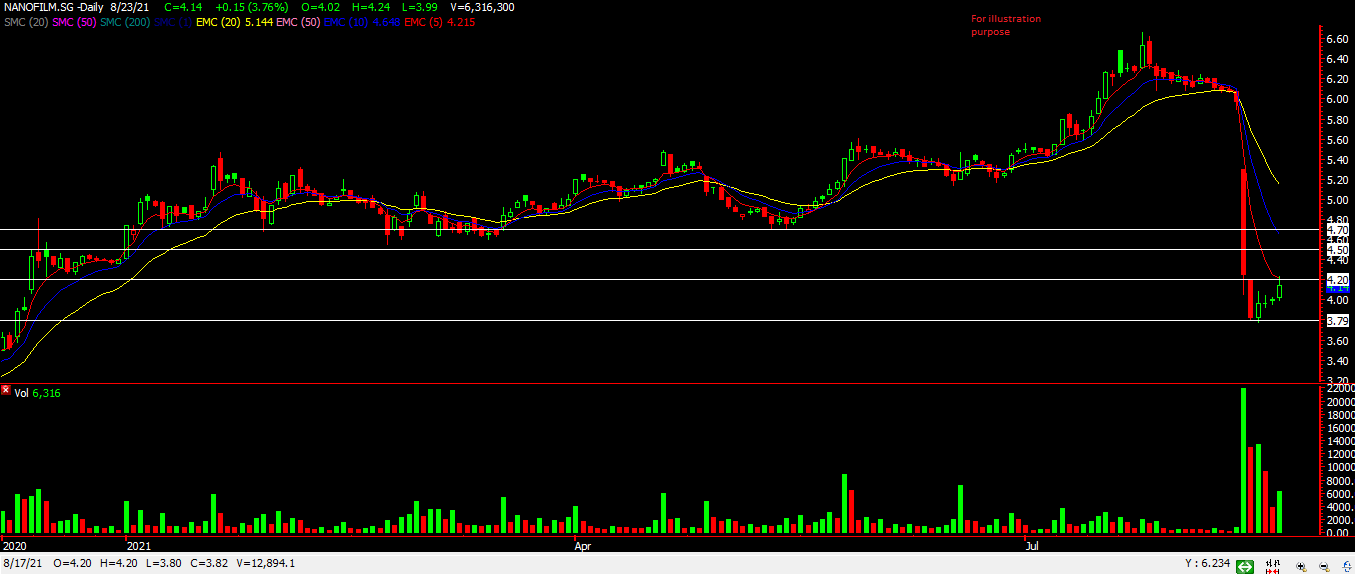
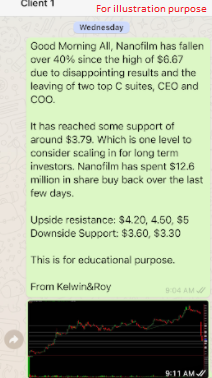
Nanofilm fell over 40% over the last week due to its bad results and the leaving of its CEO and COO. This has caused quite a big stir in the company and the share price took a plunge. Analyst has been downgrading Nanofilm and investors are fleeing. But for us, we saw this as an opportunity. Nanofilm has been good to us over the last few months and we were waiting patiently for a good set up. We finally saw it last Wednesday as a nice base was being built around the $3.80 area and the company started its share buyback. We informed our clients from the message below as we found some it time to bargain hunt.

Nanofilm staged a come back over the last two days as it hang on to the support. The upwards swing in price caused some short covering as traders who shorted probably covered and took some profits. It has hit our first upside resistance target of 10%  and taking some profits might be wise. There is still some volatility around so taking it step by step.

We have drawn our next few upside target on the chart and remembering to take profit along the way. When the next downside comes then it’ll be another opportunity to go in.

Want to be alerted of such potential entry?

Be our EXCLUSIVE CLIENT and find out how to be included in our growing community.

Yours

Humbly

Kelwin&Roy

ComfortDelgro – [ Are You Riding The Recovery Wave? What Else is Causing A Spike? ]

16th August, 2021, 4:04 PM

ComfortDelgro – [ Are You Riding The Recovery Wave? What Else is Causing A Spike? ]

Just last Friday Evening ( 13th Aug) ComfortDelgro reported its earnings of $91 million, versus a net loss of $6.6 million the previous year. Revenue in the same period was up 13.6% y-o-y to $1.74 billion, with growth seen across its various segments ranging from taxis to bus operations.

The pandemic took a toll on many sectors like transport, hospitality , retail reits but as we continue to adapt these stocks are slowly coming back. With Singapore vaccine rate at 75% now, more and more areas are being open up and our economy is starting to get back on track.

Not only that, ComfortDelgro is seeking an IPO listing in Australia for its Australian subsidiary which also gave the stock price a boost hitting our first target price in just 2 trading days. Where to now? From the chart below , our resistance is drawn at $1.71 then 1.76, will update more if those targets are hit. Volume is one of the biggest for the past few months and this might help sustain an up move in the coming days.

ComfortDelgro 16th Aug2021

Chart Source: AdvisorXs 16th Aug 2021

ComfortDelgro as been kind to us for the last few months as we caught a nice up wave for it.

Want such trade alert sent to your handphone straight? Want to join a growing pool of community of like minded traders?

Want to know what stock we’re looking at next?

Be our EXCLUSIVE CLIENT and be alerted earlier to not miss out!

Yours

Humbly

Kelwin&Roy

IFast – [ Why Did It Move Up So Fast? Renewed Interest? ]

11th August, 2021, 7:14 PM

IFast – [ Why Did It Move Up So Fast? Renewed Interest? ]IFast 11th Aug 2021

Chart Source: AdvisorXs 11th Aug 2021

From the above message we can see the speed and momentum of IFast in the morning! What a jump in price as IFast finally broke its 20ema  at $8.56 this morning and never looked back after. It’s probably one of our fastest trade that we seen, hitting our first target price of $8.84 in under an hour! The overall market was lackluster despite Dow having a good finish. The importance of choosing the correct stock can give one the mental confidence and boost your clarity in the next trade.

So lets take a look at IFast chart and analyze it from a technical perspective. From the chart, we can see it has broken above its downtrend line and also its 20ema, volume has also increased and its the highest for the week so far. These are bullish signal to us and we might likely see it move up to our second target of $9.12. Immediate resistance might be around $9 as there is a gap resistance over there too. So do note that prices might start pulling back there first.

If you would like to know how to receive such trade alerts sent to your handphone, just drop us a message and we’ll walk you through it

Want to be alerted earlier before the breakout?

Want to know what stock we’re looking at next?

Be our EXCLUSIVE CLIENT and be alerted earlier to not miss out!

Yours

Humbly

Kelwin&Roy
 

Sinostar Pec – [ Start Of A New Uptrend Wave? ]

10th August, 2021, 7:30 PM

Sinostar Pec – [ Start Of A New Uptrend Wave? ]Sinostar Pec 10th Aug 2021

Chart Source: AdvisorXs 10th Aug 2021

Sinostar Pec is one of the largest producers and suppliers of downstream petrochemical products within 400km radius of is production facilities within the Dongming Petrochem Industrial Zone in Dongming County of Shandong Province, PRC.

It had some movement just over a week ago when we first spotted it and finally it started to show its true colours today!

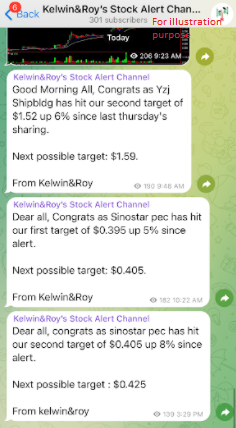
A nice consolidation for the past few weeks led to a nice breakout with volume which resulted in a 8% upswing from our entry! With such a move , a new uptrend might be forming and 0.425 target is within sight now. With an increased in volume we might even see $0.45. Watch out for the break and momentum!

If you would like to know how to receive such trade alerts sent to your handphone, just drop us a message and we’ll walk you through it

Want to be alerted earlier before the breakout?

Want to know what stock we’re looking at next?

Be our EXCLUSIVE CLIENT and be alerted earlier to not miss out!

Yours

Humbly

Kelwin&Roy

Yzj ShipBldg – [ Sleepy Giant Wakes Up, Where To Take Profit? ]

10th August, 2021, 5:22 PM

Yzj ShipBldg – [ Sleepy Giant Wakes Up, Where To Take Profit? ]Yzj ShipBldg 10th Aug 2021

Chart source: AdvisorXs 10th Aug2021

Yzj ShipBldg has finally made a move after a long consolidation of around 2 months. It has made a clean breakout of the $1.45 horizontal resistance with a strong gap up last Friday with an increased in volume. As a trader, with the gap up we might find it hard to chase as our stop loss would be higher, the risk reward for the trade is also not as good hence an earlier entry might be one of the solution.

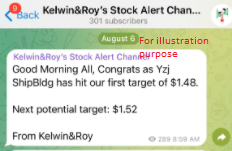
A pre-break of the horizontal line of $1.42 was actually a que to us as we saw some volume coming in and we decided to alert our EXCLUSIVE CLIENTS on Telegram about it! With an entry at $1.43 we saw a nice 6% upside in just 2 trading days!

So where to take profit? The $1.52-1.54 is quite an obvious resistance so taking some profit around this area is something a trader might consider. Or wait for a break of this $1.54 which might lead to a higher price of $1.59 or a fake breakout, consolidate and move higher in the next few weeks.

So these are some of our game plan and we’re watching to see how it pans out.

If you would like to know how to receive such trade alerts sent to your handphone, just drop us a message and we’ll walk you through it

Want to be alerted earlier before the breakout?

Want to know what stock we’re looking at next?

Be our EXCLUSIVE CLIENT and be alerted earlier to not miss out!

Yours

Humbly

Kelwin&Roy