St Engineering – [ Just As Blogged, Resisted At $3.55 For Now, What’s Our Trade Plan?]

6th November, 2018, 9:22 PM

St Engineering – [ Just As Blogged, Resisted At $3.55 For Now, What’s Our Trade Plan?]

St Engineering 6th Nov 2018

Chart Source: Poemsview 6th Nov 2018

St Engineering couldn’t break the $3.55 resistance which we drew from our previous post. 

It had a nice run from $3.46 where we alerted our EXCLUSIVE CLIENTS to $3.55 and started to come down.

Failing to break that resulted in some profit taking in which is normal as part of the market movement.

Our near term support might be at around $3.42-3.44. Holding that might see another bounce up. Currently the downtrend line is still resisting St Engineering, breaking which might take it break to $3.55 then $3.60.

What’s your trade plan like?

What’s your trade plan like?

If you need help with a trade plan you know who to Contact! 

We’re right here waiting!

Yours

Humbly

Kelwin&Roy


Straits Times Index – [ Rebound Came As Posted, Up 100+ Points, What Are We Looking At Now? ]

4th November, 2018, 9:14 AM

Straits Times Index – [ Rebound Came As Posted, Up 100+ Points, What Are We Looking At Now? ] Straits Times Index 4th Nov 2018

Chart Source: Poemsview 4th Nov 2018

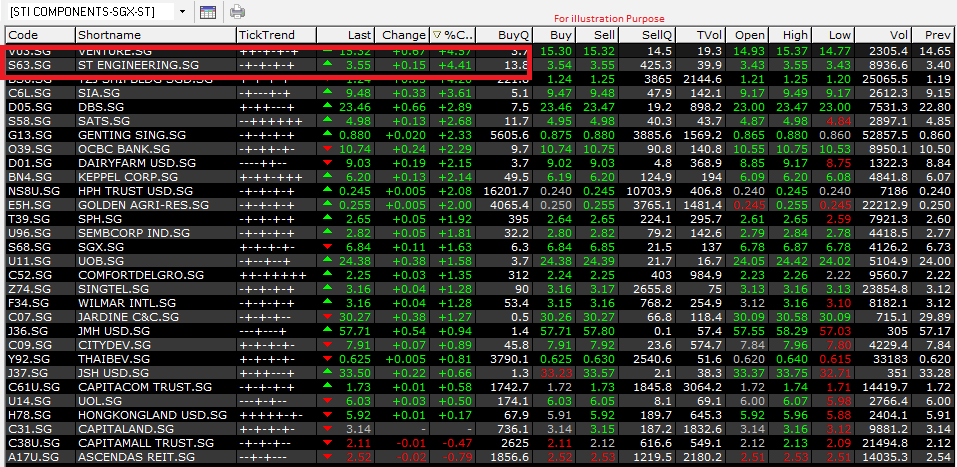
Straits Times Index had a magnificent run once again with a rebound of over 100 points since our post on it last Monday Night.

While many were still bearish and  looking to short from our post we were looking out for a rebound.

STI ran up over 100 points or close to 4% in three days causing most shortist to cover their position. Such an increase might have taken traders by surprised but we were prepared for such a run.

Blue Chips like Banks and Property Stocks led the Charge as mentioned in the same Blog Post too. We hope that our avid readers have learnt something from this and maybe even benefitted from this rebound!

So what are we seeing in STI next?

  1. We have drawn the downtrend resistance line which is around 3160 and might  be our target for this rebound for now
  2. Currently, STI almost covered the Gap resistance and is also around the 50ema resistance which is 3130 area.
  3. A pull back wouldn’t be too much to expect and a pull back might present some opportunity for short term trading.

Last week for a good week for bullish traders and we hope it was good for you too. Our list of stocks all performed well. How about yours?

We’ll be conducting a final workshop on how to use CFD to long or SHORT the STI index in Nov before the year comes to a close.

Look out for it!

Still clueless on the market direction? Not sure of which stock to look out for during a rebound?

Want to be part of this EXCLUSIVE COMMUNITY help guide and prepare for market.

Don’t wait and CLICK HERE to see how you can join this community and all the exciting perks of being a Client of Kelwin&Roy

Yours

Humbly

Kelwin&Roy

St Engineering – [ Up Over 4% In A Day, Closed At Day High, Our Next Target? ]

1st November, 2018, 7:44 AM

St Engineering – [ Up Over 4% In A Day, Closed At Day

High, Our Next Target? ]St Engineering 1st Oct 2018

Chart Source: Poemsview: 1st Nov 2018

St Engineering had a powerful rebound yesterday and was the second top gainer within the STI component. We’re glad that our EXCLUSIVE CLIENTS were informed of this trade analysis and managed to capture a 2.5% upside swing. An entry at $3.46 saw ST Engineering moving up to $3.55 through the day which came on the back of some good news too.

A nice overall bounce for the general market which lifted the STI up 52 points which we were anticipating from our previous post.

While everyone was in panic mode it was probably a good time to do some bargain hunting as most stocks were heavily. But this might not be the time to be heavily invested rather for us we prefer to be trading a little more. Making use of the rebound to do some scalping.

St Engineering was one such stock as we got our shopping list ready.

Its currently resisted at $3.55 and if it manages to stay above that  then we might see $3.60 as our next target.

What’s on our shopping list? Have you gotten ready your shopping list?

Still clueless on the market direction? Not sure of which stock to look out for during a rebound?

Want to be part of this EXCLUSIVE COMMUNITY  to help guide and prepare for market.

Don’t wait and CLICK HERE to see how you can join this community and all the exciting perks of being a Client of Kelwin&Roy

Yours

Humbly

Kelwin&Roy


Sembcorp Industries – [Multiple Downside Targets Hit, Is Upcoming Results Bad?]

30th October, 2018, 8:59 PM

Sembcorp Industries – [Multiple Downside Targets Hit, Is Upcoming Results Bad?]Sembcorp Industries 30th Oct 2018

Chart Source: Poemsview 30th Oct 2018

Sembcorp Industries part of the STI component stock could not withstand the selling pressure over the last few days. It was down 5% since our short alert to our EXCLUSIVE CLIENTS last Wednesday. A nice downside ensued after our alert at $2.87. It went to a low of $2.71 before some rebound came. Currently Sembcorp Industries is sitting on some support at the horizontal and uptrend line. A break below that and staying below it might signal more downside.

Sembcorp Industries results will be out this Friday before market hours.

What will your trade plan be? Could Sembcorp Industries break that downtrend resistance line or will it continue to slide? Is the recent fall a sign of what the results might be?

Need an extra pair of eyes to help watch the with?

Have many questions that you’ll like some answers to?

Want to be part of this EXCLUSIVE COMMUNITY  to help guide and prepare for market.

Don’t wait and CLICK HERE to see how you can join this community and all the exciting perks of being a Client of Kelwin&Roy

Yours

Humbly

Kelwin&Roy


Cityneon – [ Cash Offer At $1.30, Alerted Back In Sept! See The Trade Plan!]

30th October, 2018, 8:29 AM

Cityneon – [ Cash Offer At $1.30, Alerted Back In Sept! See The Trade Plan!]Cityneon 30th Oct 2018

Chart Source: Poemsview 30th Oct 2018

Cityneon just released news that West Knighton Limited has launched A mandatory unconditional cash offer for its shares at $1.30. A piece of good news for those still holding Cityneon. More can be read HERE.

We’re glad that we managed to spot this trade back in Sept when the huge volume came in which caught our attention and in less than two months we are greeted with something pleasant. We’re also glad that our exclusive clients were alerted on this trade analysis when Cityneon was trading at $1.16. Follow ups were done as we tracked Cityneon from $1.16  to $1.26. Read HERE for more to see how our trade plan unfolds. No HINDSIGHT!

Cityneon had a nice ride up. Till the next one! Have a Good trading Week ahead. Exciting times are ahead!

Don’t want to miss out on such trade analysis?

Want to be part of our EXCLUSIVE COMMUNITY and receive EARLY ALERTS of our stock analysis sent straight to your handphone?

Wait no more and ACT NOW to join our community.

Then be Kelwin & Roy’s client to enjoy such value added services.

See you onboard!

Yours

Humbly

Kelwin&Roy

Straits Times Index – [ Rebound In Sight After The Panic Selling? What Is The Chart Saying? ]

29th October, 2018, 8:41 PM

Straits Times Index – [ Rebound In Sight After The Panic Selling? What Is The Chart Saying? ]Straits Times Index 29th Oct 2018

Chart Source: Poemsview 29th Oct 2018

Straits Times Index fell to our planned area of 2985 from our previous post and fell further to around 2960. We’re glad that the Straits Times Index moved as planned and currently is sitting on the long term support line as drawn.

Will This support hold? Who knows right? But we’re seeing some signs of resilience and the 2960 levels seems to be holding. On Further examining, the Straits Times Index is currently being pinned down by the 5ema at around 3004. Until this can be broken then we might see some rebound in the near future.

Some points which we might see a rebound to might be 3031 and 3070 if the market continues to hold.

What are some of the stocks on your shopping list? If the market were to rebound are you prepared for it?

We have our shopping list ready! Banks, property counters are at a low, could there be good for a rebound?

Let’s watch!

Still clueless on the market direction? Not sure of which stock to look out for during a rebound?

Want to be part of this EXCLUSIVE COMMUNITY help guide and prepare for market.

Don’t wait and CLICK HERE to see how you can join this community and all the exciting perks of being a Client of Kelwin&Roy

Yours

Humbly

Kelwin&Roy

Japfa – [ Running Up On Earnings Expectations? What Did The Chart Say?]

26th October, 2018, 9:53 AM

Japfa – [ Running Up On Earnings Expectations? What Did The Chart Say?]

Chart Source: Poemsview 26th Oct 2018

Japfa started moving yesterday when it broke out of the downtrend line which we drawn.

Our EXCLUSIVE CLIENTS were notified of this breakout and we’re glad Japfa continued to moved up today reaching our second target of $0.69. That’s a 7% upside since our entry which is good to us  considering that it was hit in a day.

What are some things to note for Japfa?

  1. Its results! Its results might be coming out soon so that’s a factor to consider.
  2. It has ran ahead of its earnings. So if earnings disappoint Japfa might fall back.
  3. Since it has ran ahead of earnings, it’s earnings has better be up or future guidance has to be good or else the market might punish it.

What are you looking for?

Still not part of a community that helps look out for each other?

Want to be part of this EXCLUSIVE COMMUNITY to receive such trade analysis sent to your handphone?

Don’t wait and CLICK HERE to see how you can join this community and all the exciting perks of being a Client of Kelwin&Roy

Yours

Humbly

Kelwin&Roy

Yzj Shipbldg – [ Downside Target Met, Any Rebound? ]

26th October, 2018, 8:18 AM

Yzj Shipbldg – [ Downside Target Met, Any Rebound? ]

Chart Source: Poemsview 26th Oct

Yzj Shipbldg wasn’t spared the massive sell down that happened on Dow jones on wednesday night. Yzj Shipbldg fell to a low of $1.12 just shy of 1 cents to our second target of $1.11. We could see how Yzj Shipbldg fell off from its uptrend line and failed to regain footing above it which was a sign of more downside to come.

Our EXCLUSIVE CLIENTS were informed of this trade analysis just on Wednesday before the mayhem happened and we’re glad that our first downside target of $1.14 was hit in the first few minute of trading.

How is Yzj Shipbldg looking now? We were starting to get bearish in Yzj Shipbldg since early October if you remember. It his our downside target of $1.20 with an entry of $1.24. Since then Yzj Shipbldg started a rebound and was sold off heavily which might have damaged the uptrend.

So after any rebound for Yzj Shipbldg we might be looking for an opportunity for shorting again.

Want to be part of this EXCLUSIVE COMMUNITY to receive such trade analysis sent to your handphone?

Don’t wait and CLICK HERE to see how you can join this community and all the exciting perks of being a Client of Kelwin&Roy

Yours

Humbly

Kelwin&Roy

Wilmar – [ Moving Against The Trend, Advanced Alert Given, Let’s Take A Look]

25th October, 2018, 4:41 PM

Wilmar – [ Moving Against The Trend, Advanced Alert Given, Let’s Take A Look]Wilmar 25th Oct 2018

Chart Source: Poemsview 25th Oct 2018

Wilmar one of the rare few STI component stock that is up on such a negative day. Dow closed down 600 points and sent another selling frenzy in asia in the morning. As market started to recover so did Wilmar. Wilmar put up a good fight and almost topped the list in terms of percentage gain for the day.

We’re glad we managed to alert our EXCLUSIVE CLIENTS earlier this week on monday when Wilmar was still trading at $3.01.

Slow and steady and it managed to reach our $3.11 target within the week.

For now the $3.11 resistance for wilmar looks strong. A break above that might see it move up to cover the gap and maybe to $3.18.

Wilmar’s results will be out on 12th Nov after trading hours.

Not getting such value added services?

Want to be part of this EXCLUSIVE COMMUNITY?

Don’t wait and CLICK HERE to see how you can join this community and all the exciting perks of being a Client of Kelwin&Roy

Yours

Humbly

Kelwin&Roy

SGX – [ Rebound Came As Blogged From Last Week, Filled The Gap, Next Target? ]

22nd October, 2018, 5:20 PM

SGX – [ Rebound Came As Blogged From Last Week, Filled The Gap, Next Target? ] SGX 22nd Oct 2018

Chart Source: Poemsview 22nd Oct 2018

SGX or Singapore Exchange just released its results for their  first quarter, more can be read HERE.

In addition, analyst have a rating ‘Buy’ for SGX too. Read about it HERE.

But did you see our blog last week?  We mentioned last thursday that if SGX manages to break above it $6.95 resistance it might cover the gap to reach $7.01 and $7.05 eventually. It reached all our targets and even exceeded it to reach $7.10.

What’s our next target? If SGX manages to close above $7.09 then we might see it attempt to reach $7.23 in the coming days.

SGX closed below $7.09 so lets watch the next few days to see how it performs.

What’s your trade plan like? Having a trade plan is of utmost important!

If you need help with a trade plan you know who to Contact! 

We’re right here waiting!

Yours

Humbly

Kelwin&Roy