Sembcorp Marine – [ Turning Bullish Now? Any Earlier Signs? What Does The Chart Says?]

8th April, 2019, 8:04 AM

Sembcorp Marine – [ Turning Bullish Now? Any Earlier Signs? What Does The Chart Says?] Sembcorp Marine 8th April 2019

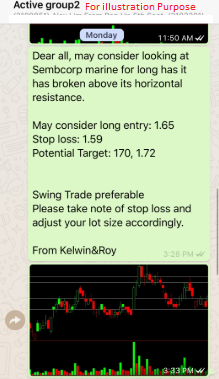
Chart Source: Poemsview 8th April 2019

Sembcorp Marine came back to life last friday with an increased in volume which is the highest for the last two weeks . With that increase in volume it has managed to breakout of the downtrend line drawn back in Oct 2018.

This is one bullish sign to us and staying above this downtrend might see it move higher to $1.72 then $1.77. Recently Oil has also seen a positive upswing with oil cut in talks. BUT, was there any earlier signs of this breakout??

Our EXCLUSIVE CLIENTS were alerted earlier just a week back when we first spotted Sembcorp Marine managing to break its horizontal resistance of $1.64. Sembcorp Marine was also near the uptrend support so it gave a trader a good risk reward ratio.  With the volume surge last friday, Sembcorp Marine hit our first target of $1.70.

Want such Alerts sent straight to your handphone?

CLICK HERE to see how you can learn how to plan a sound and actionable trade plan and to be part of this EXCLUSIVE COMMUNITY to enjoy such value added services.

Yours

Humbly

Kelwin&Roy


Sembcorp Industries – [ Five Consecutive Days Up Since Alert, Third Target Met, Overbought Now? ]

5th April, 2019, 2:37 PM

Sembcorp Industries – [ Five Consecutive Days Up Since Alert, Third Target Met, Overbought Now? ]Sembcorp Industries 5th April 2019

Chart Source: Poemsview 5th April 2019

Sembcorp Industries saw a five days upswing ever since our alert to our EXCLUSIVE CLIENTS at $2.59.

Sembcorp Industries together with Keppel Corp and Sembcorp Marine saw some good run over the last few days.

Sembcorp Industries broke above its midterm downtrend line and also the 20ema and volume came in during the days. There were good signs to us and so our EXCLUSIVE CLIENTS were alerted. We’re glad that Sembcorp Industries has risen over 6% in less than a week and booking some profits would be wise. So far three targets has been hit  which we are happy for.

Currently $2.74 is one of the resistance and some rest might be good for Sembcorp Industries before its next move up. The next resistance might be at $2.79

Want such Alerts sent straight to your handphone?

CLICK HERE to see how you can learn how to plan a sound and actionable trade plan and to be part of this EXCLUSIVE COMMUNITY to enjoy such value added services.

Yours

Humbly

Kelwin&Roy

UOL – [ Four Consecutive Up Days, Targets Met, Overbought Now? ]

4th April, 2019, 8:24 AM

UOL – [ Four Consecutive Up Days, Targets Met, Overbought Now? ]UOL 4th April 2019

Chart Source : Poemsview 4th March 2019

UOL together with some of the property stocks like Capitaland, CityDev have seen a nice powerful run up after the Draft Master Plan by URA came out last week. Blue chips property stocks took the lead and UOL was one of them.

Our trade analysis of UOL was sent to our  EXCLUSIVE CLIENTS via whatsapp for them to Plan, Prepare and Proceed with ease. UOL broke out of its horizontal resistance of $6.86 and never looked back since then. In less than a week UOL moved up by 5% hitting two of our targets which is very decent by our standards.

UOL has been moving up for the last four days and it might be getting tired too. Resistance might be around $7.21-7.23 level and if that gets taken out then we might see the previous level at $7.31 being challenged which is also the Gap resistance. Perhaps some pullback might bring some opportunity once again. Let’s keep a lookout!

Want such Alerts sent straight to your handphone?

CLICK HERE to see how you can learn how to plan a sound and actionable trade plan and to be part of this EXCLUSIVE COMMUNITY to enjoy such value added services.

Yours

Humbly

Kelwin&Roy


Thaibev – [ Top Gainer In The STI Component , Thirsting For More Upside? ]

27th March, 2019, 7:16 PM

Thaibev – [ Top Gainer In The STI Component , Thirsting For More Upside? ] Thaibev 27th March 2019

Chart Source: Poemsview 27th March 2019

Thaibev saw a very nice run of 5% today with a high of $0.86.In fact, Thaibev was the top gainer in the STI component for today!  It got a boost from a brokerage upgrade which probably helped in the upwards movement.

Thaibev opened at $0.84 this morning which might be a little high to chase which is why it’s important to position oneself a move comes.

Our EXCLUSIVE CLIENTS were alerted just last Thursday when Thaibev had some movement. Despite the downside which came after Dow’s 450 point drop, Thaibev held its ground well holding out  at the 20SMA. It is important to take note when stocks get supported like this.

Thanks to the morning run, Thaibev has hit our first target of $0.855 and the next possible target might be $0.875. Can Thaibev move up more? We can see that volume came in today, so fingers crossed!

Want such Alerts sent straight to your handphone?

CLICK HERE to see how you can learn how to plan a sound and actionable trade plan using a simple indicator like the moving average and to be part of this EXCLUSIVE COMMUNITY to enjoy such value added services.

Yours

Humbly

Kelwin&Roy

Keppel Corp – [ Moving Up With Oil, Will The Trend Continue? ]

21st March, 2019, 5:17 PM

Keppel Corp 21st March 2019

Chart  Source: Poemsview 21st March 2019

Keppel Corp had a good finish today as it came in one of the Top10 gainers for our STI component stock.

Oil was up overnight hitting 2019 highs hence giving a boost to Keppel Corp.

An earlier sign was seen as Keppel Corp actually broke above its short term downtrend line and also above its 20ema.

Our EXCLUSIVE CLIENTS were alerted once it broke at $6.17 and Keppel Corp held its ground as volume came in to support it. Our first target was met at $6.26 with Keppel Corp pushing pass it to a day high of $6.29 but failed to close above our first resistance of $6.26.

A break above that might see Keppel Corp moving to our next target of $6.34 then $6.40 eventually. Watching Keppel Corp.

Want such Alerts sent straight to your handphone?

CLICK HERE to see how you can learn how to plan a sound and actionable trade plan using a simple indicator like the moving average and to be part of this EXCLUSIVE COMMUNITY to enjoy such value added services.

Yours

Humbly

Kelwin&Roy

Valuetronics – [ Lower High On Each Rebound, What’s Next?]

20th March, 2019, 8:57 AM

Valuetronics – [ Lower High On Each Rebound, What’s Next?]Valuetronics 20th march 2019

Chart Source: Poemsview 20th March 2019

Valuetronics together with the other electronic stocks had a retracement after having a decent run up over the  last week.

Valuetronics has caught our attention for some of the reasons below.

  1. Its rebound is lower than the previous rebound at $0.74
  2. Valuetronics is below its uptrend line now.
  3. Valuetronics is near the horizontal support of $0.68. A break below that might signal more downside.
  4. Valuetronics is also below its 20ema

With these reasoning Valuetronics is now on our radar. A break below that $0.68 might have more downside.

Is Valuetronics on your watchlist?

What’s your trade plan for Valuetronics like?

It is important to have a sound and actionable trade plan in order to be discipline in your trades.

CLICK HERE to see how you can learn how to plan a sound and actionable trade plan and to be part of this EXCLUSIVE COMMUNITY to enjoy such value added services.

Yours

Humbly

Kelwin&Roy


OCBC – [ 3rd Target Met, Next Resistance At The Gap?]

19th March, 2019, 7:05 PM

OCBC – [ 3rd Target Met, Next Resistance At The Gap?]OCBC 19th March 2019

Chart Source: Poemsview 19th March 2019

OCBC along with the other two banking stocks continue it run up today edging up 0.6% before a slight retracement.

With the run up today OCBC  hits our third target of $11.29 for this round up 2% since our ALERT

With the $11.29 resistance as mentioned yesterday on the blog overcoming that might see OCBC move up to $11.41 at the Gap resistance.

The gap resistance might be a tough resistance to overcome so it might be wise to take some profit off the table since our ALERT using the simple moving indicator spotted it at $11.06.

Want such Alerts sent straight to your handphone?

CLICK HERE to see how you can learn how to plan a sound and actionable trade plan using a simple indicator like the moving average and to be part of this EXCLUSIVE COMMUNITY to enjoy such value added services.

Yours

Humbly

Kelwin&Roy


OCBC – [ Catching The Rebound Using Moving Average, Second Target Met!]

18th March, 2019, 12:07 PM

OCBC – [ Catching The Rebound Using Moving Average, Second Target Met!] OCBC 18th March 2019

Chart Source : Poemsview 18th March 2019

OCBC started the Monday morning with a nice upside following Dow Jones lead on friday night. Singapore banks were generally up with OCBC taking the lead up close to 1% before lunch time.

A break above the 5ema at $11.06 for OCBC gave a clue and our EXCLUSIVE CLIENTS were alerted on it.  Just within a day and two of our targets were met with $11.20 being the latest target to be hit.

OCBC might see more upside if it can hold above the 20ema which is at $11.20. The next possible upside might be $11.29.

Want to know how to use a simple indicator like the moving average to strengthen your analysis?

CLICK HERE to see how you can learn how to plan a sound and actionable trade plan using a simple indicator like the moving average and to be part of this EXCLUSIVE COMMUNITY to enjoy such value added services.

Yours

Humbly

Kelwin&Roy

SGX – [ When Will The Selling End? Signs To Look Out For]

14th March, 2019, 8:00 AM

SGX – [ When Will The Selling End? Signs To Look Out For]SGX 14th March 2019

Chart Source: Poemsview 14th March 2019

SGX or Singapore Exchange as some may call it  took  a heavy beating over the past week down 10% since the high of $8.05.

News came out that the Hong Kong stock exchange would start trading derivatives contracts based on Chinese-listed shares pose a new competitive threat to SGX.

Since then SGX gave up 2 months worth of gains in just 5 trading days!

Now is the selling over? Is the selling overdone? Is a rebound in sight? Here are a few things we’re looking out for

  1. For support to hold at$7.20 if not the next level at $7.10 area.
  2. For the volume to start decreasing might mean that selling is slowing down.
  3. For the candlestick to be smaller and not such a long range.
  4. For SGX to regain its hold on the 200ma and even the uptrend line which it has broken down from

Keeping a close eye on SGX for the next few days.

Is SGX on your watchlist?

What’s your trade plan for SGX like?

It is important to have a sound and actionable trade plan in order to be discipline in your trades.

CLICK HERE to see how you can learn how to plan a sound and actionable trade plan and to be part of this EXCLUSIVE COMMUNITY to enjoy such value added services.

Yours

Humbly

Kelwin&Roy

UMS – [ Continues Its Rise, Hitting Resistance Soon?]

13th March, 2019, 9:26 PM

UMS – [ Continues Its Rise, Hitting Resistance Soon?]UMS 13th March 2019

Chart Source: Poemsview 13th March 2019

UMS continues its rally as Hi-P took the lead causing some spillover effect to the other electronic stocks.

Since our EARLIER ALERT back in February UMS hang on steadily to the 5ema which continued to support it.

UMS has hit multiple upside targets but could be hitting some strong resistance very soon. The upper trendline could be the next resistance so we won’t be over bullish on UMS for now since our alert was way back at $0.725.

Want analysis like UMS sent to your handphone?

CLICK HERE to see how you can learn how to be part of this EXCLUSIVE COMMUNITY to enjoy such value added services.

Yours

Humbly

Kelwin&Roy