UMS – Did You Watch That Break As Mentioned?

23rd July, 2020, 7:18 PM

UMS – Did You Watch That Break As Mentioned? UMS 23rd july 2020


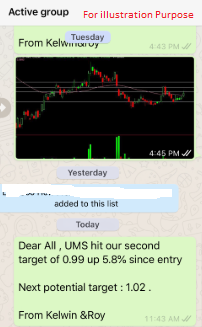
Chart Source : Poemsview 23rd July 2020

UMS broke out of that 98 cents resistance which we drew in our previous post. Volume for today is one of the highest for the couple of months so with that, hopefully we will see our third target of $1.02 being hit. It’s just 1 cent away now. So fingers crossed that it’ll hit tomorrow.

And as usual, we advocate slow and steady, so do remember to take some profits as we aim for UMS to hit $1.08 in the coming days. UMS has seen a nice run up since our alert at 93 cents so taking some profit off the table is something we advocate too. No one can sell at the highest and it’s always on hindsight that we know where is the highest or lowest.

Want to receive such alerts sent straight to your handphone?

BE OUR EXCLUSIVE CLIENT and find out how you can enjoy such value added service.

Yours

Humbly

Kelwin&Roy

UMS – Watching For The Next Break If You Missed The First!

22nd July, 2020, 7:35 AM

UMS – Watching For The Next Break If You Missed The First!UMS 22nd July 2020

Chart Source : poemsview 22nd July 2020

UMS another mid-cap electronic stock that saw a nice move up but of course the day belong to AEM yesterday.

Will UMS be able to breakout from its consolidation range?  Let’s take a closer look at it from a technical perspective.  The 98 cents is a strong resistance that is  pinning it down for the  last two months.

The first sign of strength was yesterday when it crossed the 5ema and volume also came in during the day. It was then we also alerted our clients on UMS as we saw momentum coming in. It carried on from $0.935 to close at the day high at $0.975 helping us to achieve our first target. If UMS finally manages to pierce through that 98 cents and close above we might finally see it challenge the $1.02 then $1.05.

Be alert! If momentum continues for the electronic stocks we might see UMS move more to the upside.

Want to be part of this EXCLUSIVE GROUP that were alerted of such a trade analysis?

Wait no more! CONTACT US NOW to see how you can be part of this group to receive value added service sent straight to your handphone.

Yours

Humbly

Kelwin&Roy

AEM – Here’s What Happen Yesterday Before The Massive Run Up Today!

21st July, 2020, 7:00 PM

AEM – Here’s What Happen Yesterday Before The Massive Run Up Today!AEM 21st July 2020

Chart Source : Poemsview 21st July 2020

AEM took traders by surprise with an almost 20% increase today. It closed at $3.77 eventually 4 cents off the day high. An excellent upside if you ask us.

Of course let’s not talk about the upside but it’s important to know what might have led to this breakout.

Just yesterday when AEM was trading above its uptrend line, it caught our attention as we saw some strength in that. It also managed to move above the 10ema. From a technical perspective, these are signals which one must take note of. In addition, AEM is one of the stronger electronic stock in our singapore market.

As such, we alerted our EXCLUSIVE CLIENTS on this trade when AEM was at $3.15 so that they can plan, prepare and proceed. AEM closed well yesterday and there was an increase in volume too which might support a further upside. True enough we were glad our observation paid off. AEM moved  up to the $3.40 resistance and broke past it with conviction and never looked back after that. It went to a day high of $3.81 an increase of 20% since our entry.

Many are asking what might be the next target. We are looking at around $3.95 as the next potential upside if $3.80 manages to hold up. Let’s watch!

Want to be part of this EXCLUSIVE GROUP that were alerted of such a trade analysis?

Wait no more! CONTACT US NOW to see how you can be part of this group to receive value added service sent straight to your handphone.

Yours

Humbly

Kelwin&Roy

Wilmar – Coming Close To Jan’s High, IPO Hype, What’s The Plan Now?

16th July, 2020, 7:53 AM

Wilmar – Coming Close To Jan’s High, IPO Hype, What’s The Plan Now?Wilmar 16th july 2020

Chart source: Poemsview 16th July 2020

Wilmar part of the STI component stock saw a nice push up yesterday in the late afternoon. It closed up 2.1% which also nicely met our first upside target of $4.34. It was just a week back when we saw Wilmar being supported by the 5ema which we then alerted our EXCLUSIVE CLIENTS.

The listing of ts subsidiary could be one factor for this upside and another could be the general positive sentiment through the overall market.  More of Wilmar’s China IPO can be read here.

It also saw an increase in volume today too which might support the price to the next upside $4.38 and might even push it higher to our second target of $4.46.

Stay alert and let’s watch!

Want to be part of this EXCLUSIVE GROUP that were alerted of such a trade analysis?

Wait no more! CONTACT US NOW to see how you can be part of this group to receive value added service sent straight to your handphone.

Yours

Humbly

Kelwin&Roy

Capitaland – [ Landed On Our First Target, Next Target? ]

2nd June, 2020, 6:55 PM

Capitaland – [ Landed On Our First Target, Next Target? ]

Capitaland 2nd June 2020

Chart Source: Poemsview 2nd June 2020

Capitaland came in the top 3 in terms of percentage gain.  It trailed slightly behind SATS and SIA which both also had a good showing and finished up 5.72%. Market was strong overall partly due to the end of circuit breaker and gradually opening up the economy.

From the chart we can see that Capitaland had about two months of consolidation and it finally broke out yesterday. We’re glad we managed to catch this move up and ALERTED our clients of this trade analysis.

Capitaland broke above the 50ema and saw a nice run up to $3.15 closing at $3.14. Our first target of $3.12 was met, a nice upside of over 3% in a day. As the consolidation was for awhile, we’re hoping for the next target to be met. Fingers cross.

Want to be part of this EXCLUSIVE GROUP that were alerted of such a trade analysis?

Wait no more! CONTACT US NOW to see how you can be part of this group to receive value added service sent straight to your handphone.

Yours

Humbly

Kelwin&Roy

City Dev – [ Developing A Bearish Trend? ]

24th May, 2020, 7:27 PM

City Dev – [ Developing A Bearish Trend? ] City Dev 24th May 2020

Chart Source: Poemsview 24th May 2020

City Dev part of the STI component and a leading global real estate property developer. It saw some heavy selling last friday due to the unrest in Hong kong.

Now is City Dev in bearish terrority? From the technical charts we can see that it is below the 200ema. A stock that is below this long term indicator is considered bearish from a chartist point of view. With that and also breaking the short term uptrend line we drew we ALERTED our CFD Clients on a potential short.

CFD Clients were alerted on 13 May when City Dev broke the uptrend line and also below its 20ema. City dev continue to slide down to our first target of $7.56 and is now just 2 cents to our second target of $7.36. City dev was trading at $7.37 at close.

The volume traded last friday was rather high and this might signal more downside if it breaks the horizontal support of 7.34. The next downside target might be 7.03!

Want to be part of this EXCLUSIVE GROUP that were alerted of such a trade analysis?

Wait no more! CONTACT US NOW to see how you can be part of this group to receive value added service sent straight to your handphone.

Yours

Humbly

Kelwin&Roy

Yzj Shipbldg – [ At Support, Will It Break? ]

6th May, 2020, 8:56 AM

Yzj Shipbldg – [ At Support, Will It Break? ]Yzj Shipbldg 6th May 2020

Chart Source: Poemsview 6th May 2020

Yzj shipbldg is sitting on its uptrend support line and the 20ema. A break of that might see it move lower to the next support level which we have drawn.

It is currently also resisted by the downtrend resistance line. Which camp are you on? The bulls or the bears?

We’re more inclined towards the downside. Lets watch in the coming days.

If you want to learn how to use Poems CFD to short the markets feel free to drop us a message.

A trader who only knows how to go long and now short has lost half the battle already! So picking up a new skill during this period is critical!

Yours

Humbly

Kelwin&Roy

DBS – [ Rebound or Down? ]

23rd April, 2020, 7:07 PM

DBS – [ Rebound or Down? ] DBS 23rd April 2020

Chart Source: Poemsview 23rd April 2020

DBS has been seeing selling in its shares for the past week. It broke down from our uptrend line and also the 5ema which gave us some conviction to alert our CFD clients on this potential analysis.  To add further pressure to the already stressed up system, news came out regarding Hin Leong Trading.  Many banks were involved in this high profile cases now.

As DBS broke its uptrend line of 19.12, the downward pressure came in and took it down to our first target of $18.50. We saw a slight rebound and a test of the 5ema but DBS failed to gain footing above it.

If DBS can’t close above this in the next few days we might see more downside. Which camp will you be on?

Want to be part of this EXCLUSIVE GROUP that were alerted of such a trade analysis?

Wait no more! CONTACT US NOW to see how you can be part of this group to receive value added service sent straight to your handphone.

Yours

Humbly

Kelwin&Roy


Straits Times Index – [ Has It Peaked? More Room For Upside?? ]

19th April, 2020, 9:36 PM

Straits Times Index – [ Has It Peaked? More Room For Upside?? ]Straits Times Index 19th April 2020

Chart Source: Poemsview 19th April 2020

Straits  Times Index or STI had a very good  rebound which caught many off guard. The rebound was about 20% from the low which was slightly stronger than expected. The question is can STI move up more? Is there still room to go for STI?

Before we dive  further, we’ll bring in the chart of S&P as markets still takes some reference from big brother USA.

Using the weekly chart for S&P, we feel that there might be just be more room for an upside probably to the 50ema which is around 2960 level for S&P, if it does reach around there , we have to be very very careful already. That would mean that S&P would have rebound 35% off the low which is considered a lot. But that said, we are in extraordinary times and such a bounce is also an extraordinary bounce.

So if S&P still has some upside, we might see STI slowly trying to aim for its 50ema too which is around 2720 and also the fibo 50% retracement level.  If STI can rally to around that area, we’ll be looking for SHORT opportunities. The risk reward for longs now is not very favourable (in our view) so we’ll probably be patiently looking for short opportunities instead.

Looking for Short opportunities but not sure how to go about doing it? Not sure how to short or not sure what instrument to use for for shorting? Want to learn how to use CFD (Contract for difference) to short the market?

Don’t be shy and just drop us a message and we’ll be glad to answer them!

Yours

Humbly

Kelwin&Roy


STI Updates – [ Support & Resistance Levels]

14th March, 2020, 10:28 PM

STI Updates – [ Support & Resistance Levels]Straits Times Index - 14th March 2020

Chart Source: poemsview 14th March 2020

What a week right? A rough week would probably be an understatement! Oil crashed, Dow crashed, Yield crash, limit down, limit up and there is still no sign of Covid-19 letting up.

But hold steady and lets have faith that we’ll get through this together. By now, we’re sure Covid-19 is no stranger to the world. Its been grabbing headlines for all the wrong reason and markets are plunging due to fear of how this virus will impact the economy. We’ll still continue to look at our charts to find some clues on when the selling might subside or when a technical rebound might come.

For our STI, we have drawn some support and resistance levels and will be using it as a guide to try to navigate through this crazy times. The first support we see is at around 2510 level, the low of 2016. It had some rebound from there on friday and a good rebound might see STI to close to 2700. We’ll take things step by step for now and after 2700 then 2750 area. The support for us is at 2510 then 2415.  No one can tell when the market will bottom or where the top is therefore its important to have the right mentality when investing or trading.

Don’t fish for the bottom but plan your investment in batches.

Take care when trading and its always good to have an extra pair of eyes to look out for especially during this period.

Have you prepared your shopping list? Drop us a message and we can discuss more.

Yours

Humbly

Kelwin&Roy