IFast -[ Broke The All Time High, Reviewing This Trade And How To Trail Your Profit Levels

19th January, 2021, 7:15 AM

IFast -[ Broke The All Time High, Reviewing This Trade And How To Trail Your Profit Levels IFast 19th Jan 2021
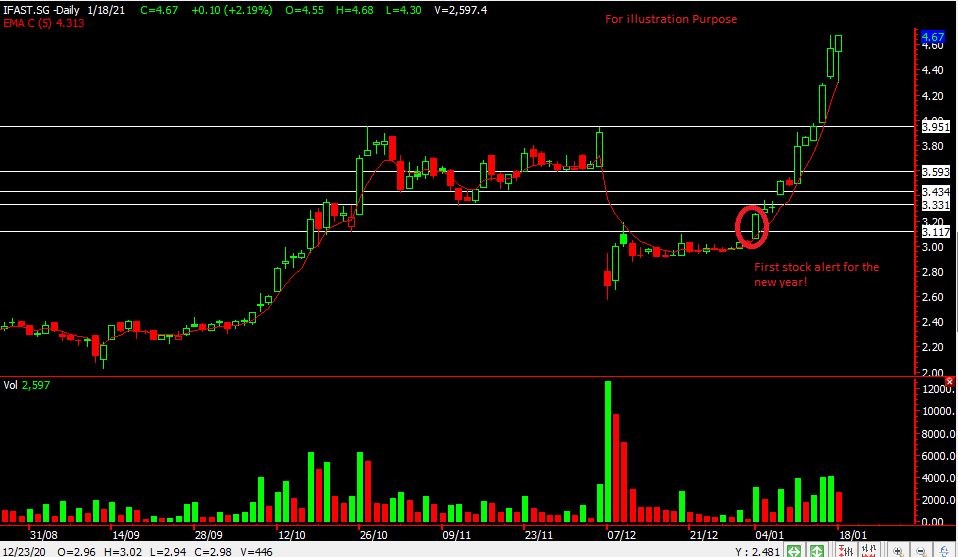
Chart Source: Poemsview 19th Jan 2021

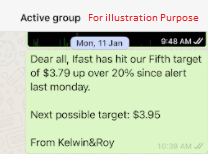
It’s a very good start for IFast as it has seen its price rocketed over 50% since its opening price of $3.06 and a closing of $4.67 as of 17th Jan. Unbelievable and rare to find in the Singapore stock market. We’re just glad that we managed to catch this stock from the start of this year and starting the year on the right foot.

Many have asked what’s the outlook for IFast, how much further can it go? Can still enter? We’ll try to share as much so hopefully you’ll have a better perspective on how we look at the markets.

For a start, we’ll be honest and admit that we didn’t expect IFast to run that much and that fast. That I think most people wouldn’t be able to tell. But what we can share if how we can go about tackling such trades. Firstly, a look at the company’s fundaments to see if such a stock might be worth trading or even holding. IFast had an impressive track record so far and is a growing company with a growing asset under its arm. Something which we mentioned in our blog post. 

Secondly as we enter a trade and as it hits our target, one can either take profit or start placing a stop loss at the entry point once the stock has hit our second target. If it has moved further set it to the second target as ur trailing stop loss. One might also consider using the 5ema as a guide when a stock starts displaying a powerful uptrend like IFast. It is an illusion to think that one can always take profit at the top. Sorry to burst your bubble, even after more than 10 years of trading we still can’t take profit at the top of the top. =)

Thirdly, decide if you’re trading or investing. If you can’t decide why you’re entering the trade or the answer is I don’t know or I everything then you’re probably going to end up with very mixed results. Trading and investing are two very different things and mixing it up usually will result in very mixed results. When you’re suppose to hold you sell, when you’re suppose to sell you hold. So make up your mind, be clear in your actions.

We hope we shed some light for trading such stock . From the chart, we can see that IFast touched the 5ema and started having some rebound. If it closes below the 5ema for more than two -three days then it might signal more downside if not continue to enjoy the trend.

Want to cut through the noise and get such trade alerts sent straight to your handphone? In addition, have such a detailed follow up?

Then be our EXCLUSIVE CLIENT and find out how you can be included in our trading community.

See you onboard soon!

Yours

Humbly
Sembcorp Industries – [ Pushing Upwards, Looking For A Further Break ]

13th January, 2021, 7:05 AM

Sembcorp Industries – [ Pushing Upwards, Looking For A Further Break ]Sembcorp Industries 13th Jan 2021

Chart Source: Poemsview 13th Jan 2021

Sembcorp Industries bucking the overall down day in the STI to come up as one of the top gainers yesterday.

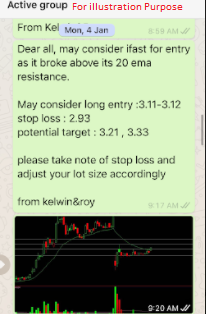
Will the trend continue? Lets take a look from a technical perspective. Sembcorp Industries had a month long consolidation from Dec till Jan and started to show sign of bullishness . In fact when it broke above the 20ema together with an increase in volume just last Wednesday we saw it as a bullish sign and alerted our EXCLUSIVE CLIENTS. The breakout was at $1.74 and since then  we saw a nice upside of over 5% in a week. Does it still have legs to move up? We think its possible for it to test the $1.88 resistance then maybe a short break and try to push further to the $1.94 level which you’ll need to zoom out of the chart to have a better look. We’ve been covering Sembcorp Industries since last Oct so take a read over here to gain more knowledge about it.

Want to cut through the noise and get such trade alerts straight to your handphone?

Then be our EXCLUSIVE CLIENT and find out how much value is waiting for you!

See you onboard soon!

Yours

Humbly

Kelwin&Roy


Keppel Corp – [ Run Just Started Or Late In The Run? ]

10th January, 2021, 8:10 AM

Keppel Corp – [ Run Just Started Or Late In The Run? ]Keppel Corp 10th Jan 2021

Chart Source: : Poemsview 10th Jan 2021

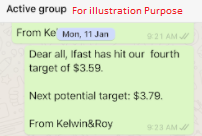
Keppel Corp is part of the STI component stock and it broke out of its long term downtrend line last Wednesday which was a bullish price action for us. We alerted our EXCLUSIVE CLIENTS on this breakout and we’re glad it started to move up the next few days.

From the chart this move could have further legs as it has consolidated for around a month and we can see volume coming in the last few days too. We could use poems CFD to swing this trade to around $5.77 and if market continues its bullish we might see Keppel Corp push to $6 in the coming weeks. With Keppel Corp trying to monetise some of its $17.5 billion of assets over time might be a catalyst for further upside. It has also laid out its 2030 blueprint back in may2020 which could boost its longer term horizon. We prefer to swing this trade using poems CFD which you can learn more over HERE.

Missed the breakout for Keppel Corp? Want such trade alerts sent to your handphone straight?

Then be our EXCLUSIVE CLIENT and find out how much value is waiting for you and how you can be included in our community.

See you onboard soon!

Yours

Humbly
Kelwin&Roy


Wilmar – [ Anymore Room For Upside After Such A Strong Run?]

9th January, 2021, 6:42 PM

Wilmar – [ Anymore Room For Upside After Such A Strong Run?]Wilmar 9th Jan 2021

chart source: Poemsview 9th Jan 2021

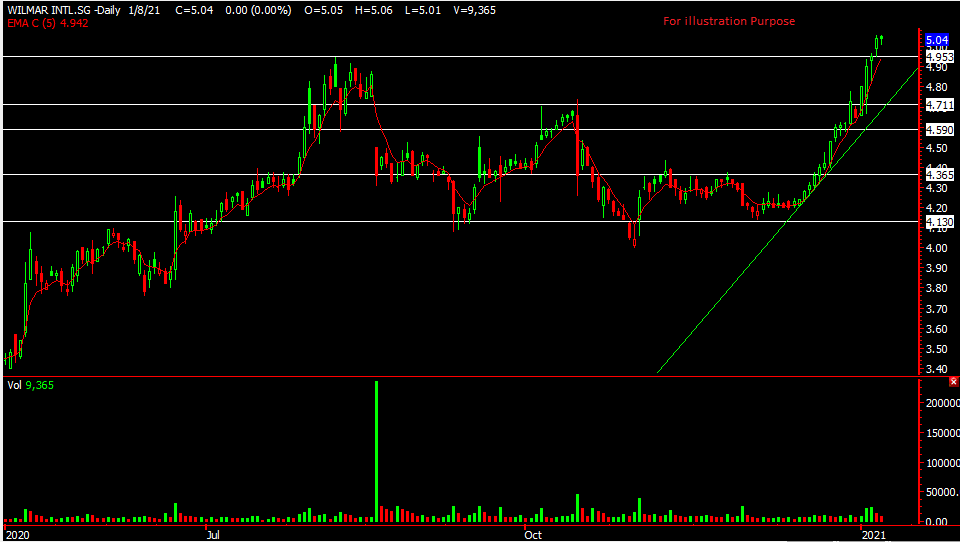
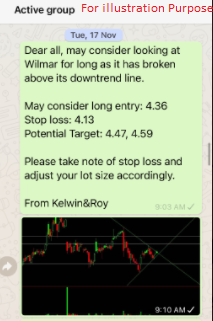
Wilmar had a nice upside of over 20% since its base was formed around $4.2 in early December. We alerted our EXCLUSIVE CLIENTS back in late Nov when Wilmar started to show some signs of interest. Holding on to this trade saw a saw eventual upside of over 15%. In order to hold on to this trade, one could either pay up fully or consider using some leverage instrument like CFD. This enables the trader to hold on to the trade for a longer time if one feels that the stock has more upside potential.

For now lets take a look at Wilmar’s chart and see if there is more room for upside. Wilmar had been having share buy back around Nov 2020 to even in Jan which could be a reason for the recent spike in price. It has risen about 20% from December and the next potential target might be around $5.20 level.  The risk reward for now isn’t favourable in our view and would prefer for a pullback to the 5, 10ema or the uptrend support line. If we missed this trade we would prefer to wait and not chase or maybe look at another stock rather than trying to buy high and try to sell higher.

Want to learn more about CFD? We made some videos on it so just click HERE to learn more and of course if you have questions feel free to drop us a message.

Also, if you want to get such trade alerts straight to your handphone with such a follow up service,

Then be our EXCLUSIVE CLIENT and find out how much value is waiting for you!

See you onboard soon!

Yours

Humbly

Kelwin&Roy

Happy New Year 2021! We Started Off With A Blast!

4th January, 2021, 6:22 PM

Happy New Year 2021! We Started Off With A Blast!

Image source: freepik.com

Blessed New Year from us and what a blast it was! The first day of 2021 started well for us and we hope the same for you all too.

Image source: SGX.com

Image source: stocksbnb.com

UMS 4th Jan 2021

Image source: sginvestors.io

We’re thankful that stocks like UMS, SGX, Frencken and Ifast all moved up nicely hitting our targets. Eletronic stocks saw some interest with UMS moving up the most as compared to the usual suspect like frencken and AEM.

Will provide more updates on some of the stocks in our next few post with some technical points to look out for so keep a look out for it.

Yours

Humbly

Kelwin&Roy

DBS – [ Momentum Slowing Down? Time To Take Some Profits? ]

26th November, 2020, 7:00 AM

DBS – [ Momentum Slowing Down? Time To Take Some Profits? ]

Chart Source: Poemsview 26th Nov 2020

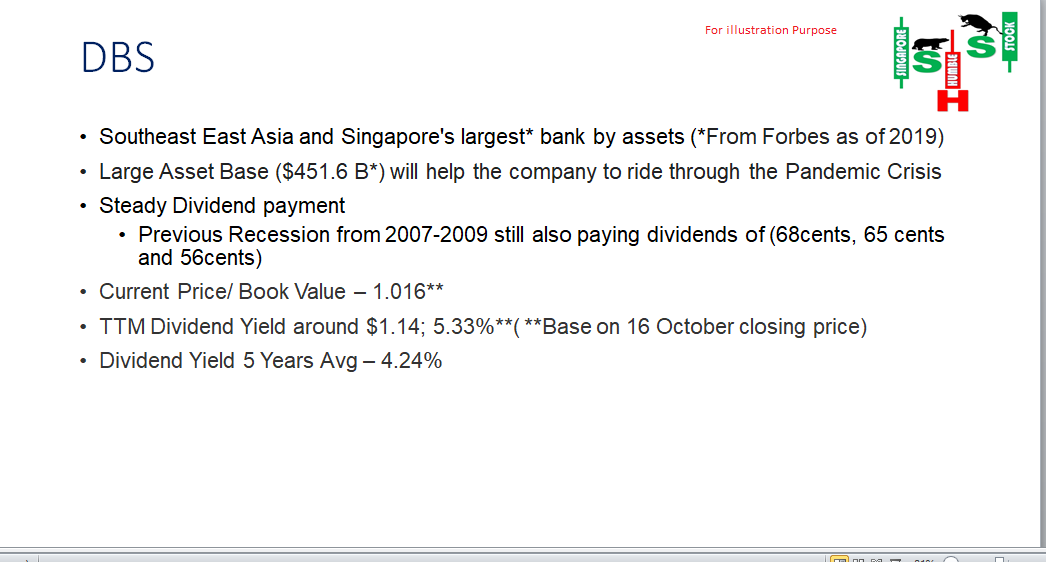
DBS named the best bank in the world in 2018 was a stock that has been on our watchlist for a long time!

Back in late Sept when we posted on DBS it was just trading slightly below $20. We continued to update our clients in mid  OCT (see above for a snap shot)  and an update again in late Oct. Since then, DBS has rocketed over 25% and we hope you managed to catch a ride on this rocket!

So the question is, is it time to take profits? Well, the answer really lies on your objective for entering. If this trade has met your objective price target, then it’s wise to sell or at least take some profits.

If your objective was to invest in the banks for dividends for the long haul, then selling now and putting your funds back in the bank might not be the best thing. Banks interest rates as we all know are rock bottom *psst* its 0.05% the last we checked. Just check out the rates HERE! So leaving it in the stock might be a wiser thing to do unless you have somewhere else you want to deploy your funds too. At current price, DBS yield is around 4% still decent as compared to leaving it in the bank.

So now lets take a look at the chart to get some sense of direction. From the technical perspective, DBS saw an increase in volume today but the candle didn’t show a full body one and it actually closed slightly below its opening price. Short term wise, we feel DBS might be over extended and a pullback to the 5ema first would be healthy and a pullback to 10ema would be even better! We have drawn the support and resistance for reference too. Common indicators are also showing signs of overbought region. We would prefer a pullback before an entry!

Want to cut through the noise and get such trade alerts straight to your handphone?

Then be our EXCLUSIVE CLIENT and find out how much value is waiting for you!

See you onboard soon!

Yours

Humbly

Kelwin&Roy

Keppel Corp – [ Up 10% Since Alert, Next Stop?]

23rd November, 2020, 7:17 AM

Keppel Corp – [ Up 10% Since Alert, Next Stop?]

Image source: Keppelcorp.com

Keppel Corp 23rd Nov 2020

Image Source: Poemsview 23rd Nov 2020

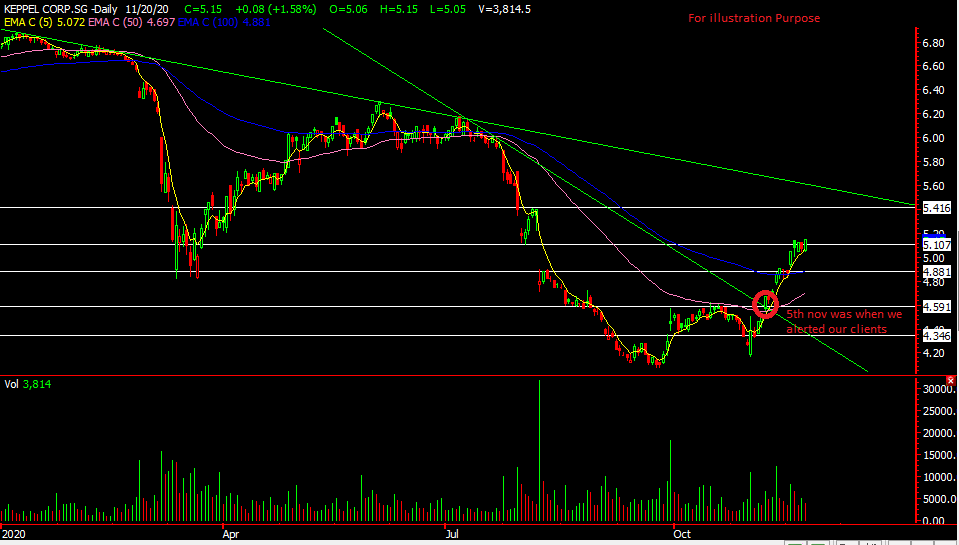
Keppel Corp one of Singapore’s stock darling has been on a downtrend for awhile before finding some footing at the double bottom of around $4.08. It was only after it released its recent set of results that actually saw some buying interest. It’s also part of the STI component stock hence we can see why STI has been moving up.

The bullish engulfing candle on 30th Oct came with volume which caught our attention but as there was a downtrend line and the 50ema nearby we waited for confirmation. So as Keppel Corp gathered strength we alerted our clients on 5th Nov of this trade analysis. Letting them in on how we analyze our stocks as seen from above. We’re glad it hit our second target of $5.10 up 10% since our alert. So what’s next for Keppel Corp?

As usual, let’s take a look at the chart to see it from a technical perspective. As Keppel Corp has risen a fair bit from the bottom, a break or pullback would be healthy in order for it to continue its upwards move. A pullback to the 5ema of around $4.80 might be an opportunity to scale in if you missed the first round. An eventual target we might see could be the longer term downtrend line of around $5.40+.

Continue  to keep watch!

Want to cut through the noise and get such trade alerts straight to your handphone?

Then be our EXCLUSIVE CLIENT and find out how much value is waiting for you!

See you onboard soon!

Yours

Humbly

Kelwin&Roy

SATS – [ Time To Take A Breather? ]

20th November, 2020, 7:10 AM

SATS – [ Time To Take A Breather? ]

Image source: Sats.com

Sats 20th Nov 2020

Chart Source: Poemsview 20th Nov 2020

With news of a potential vaccine coming out, transport, airline, hospitality all saw a nice recovery. Sats is one of them that benefited from this news. As Sats is part of the STI component stock, it has also pushed the STI up for the last few days.

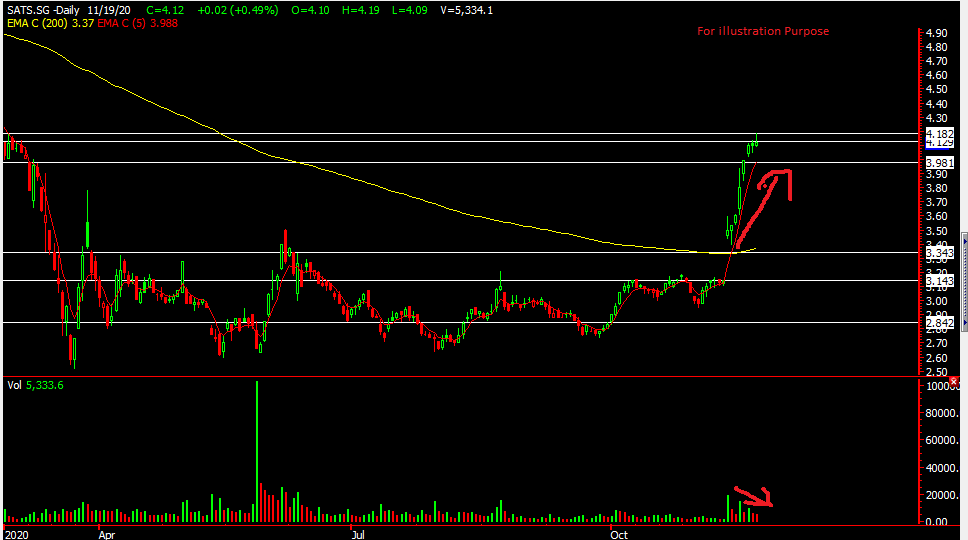
Way back in Aug Sats was already mentioned here in our Blog and in late Oct we updated once more when  Sats was trading around $3.14. A month later and it’s now trading at $4.14 a very nice upside of over 30% since oct.  Now with all the optimism in the air and with prices running up quite a bit, the question is is it time to rest?

To answer that, let’s take a look at the charts. Firstly, we noticed that as the price increases, the volume actually starts decreasing, not the most positive sign for a strong uptrend. Also common indicators would show it being in the overbought region too. Lastly, it had an eight day move up ever since the gap up so some rest or pullback is not much to ask for. Current resistance is around $4.18 – $4.20 and some pullback to $4 which is around the 5ema or slightly lower would be healthy for SATS.

Keep a lookout!

Yours

Humbly

Kelwin&Roy

OCBC – [ Sector Rotation, Cyclical Sectors Benefiting]

11th November, 2020, 5:49 PM

OCBC – [ Sector Rotation, Cyclical Sectors Benefiting]OCBC 11th nov 2020

Chart Source: Poemsview 11th Nov 2020

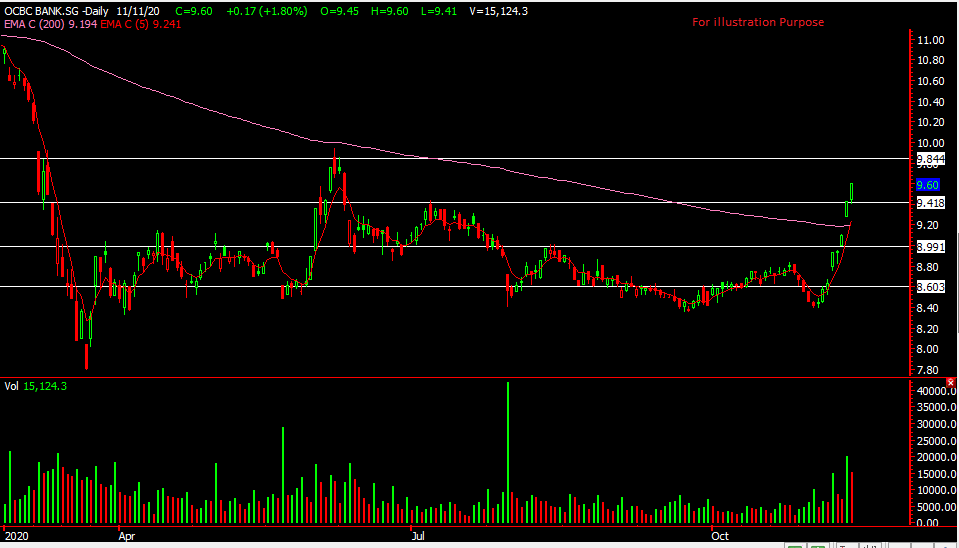
OCBC along with the other two banks saw a surge in price over the last few days and even before the election results were out. As these three banks make up quite a heavy component of the STI, it was no surprise that we saw the STI trending up the last few days too.

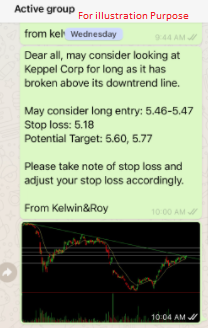
We wanted to be prudent and wait for results to be out before entering the market as we never know what may happen and anticipating results could result in being a hero or zero! As OCBC showed signs of interest and life on monday we alerted our EXCLUSIVE CLIENTS on this trade analysis and we’re glad OCBC gave us a favourable run. From our alert of $9, it has ran up to $9.58 which is more than 6% in three days!

From a technical perspective , OCBC has ran up for about 5 days and today’s volume has started to decrease. Some possible scenarios, we might see it push higher to our next target of around $9.84 which is also the gap resistance in the next couple of days. Optimism on vaccine news has funds flowing to the more cyclical sectors on hopes of recovery. It could also take a break as it ran up quite a bit so having a break is a positive thing. We’ll prefer for a retracement before looking at it again.

Want to cut through the noise and get such trade alerts straight to your handphone?

Then be our EXCLUSIVE CLIENT and find out how much value is waiting for you!

See you onboard soon!

Yours

Humbly
Kelwin&Roy

AEM – [ Here’s What We Did Today, Bullish Candle, Can It Sustain?]

9th November, 2020, 10:44 PM

AEM – [ Here’s What We Did Today, Bullish Candle, Can It Sustain?]AEM 9th Nov 2020

Chart Source: Poemsview 9th Nov 2020

AEM saw a strong push up today up over 5%! Head over to our facebook page to find out what we did today!

https://www.facebook.com/singaporehumblestock/posts/3261163827344303

With a good volume coming in, we might see AEM heading towards the next resistance of $3.90

Don’t forget to checkout our facebook and see how you can be the first to receive such trade alerts!

Yours

Humbly

Kelwin&Roy