HPH Trust – [ A New Up Wave Coming? Let’s See The Charts]

10th November, 2020, 7:07 AM

HPH Trust – [ A New Up Wave Coming? Let’s See The Charts]HPH 10th Nov 2020

Chart Source: Poemsview 10th nov 2020

HPH Trust USD saw an increase in volume with a nice upside movement too. Let’s take a look at it from a technical perspective. It has broken above its horizontal resistance of $0.148 and with volume coming in we might see it push towards the next resistance at $0.16 and maybe even $0.167.

With biden winning the US election , a less aggressive foreign policy could see some relief in the shipping sector.

Keep a close eye for HPH Trust. We’re looking at the USD one so take note of the foreign currency.

Yours

Humbly

Kelwin&Roy

S&P 500 – [ Crash? Stress? Distress? Let’s Confess, No One Can Predict A Crash, Our Two Cents Worth]

30th October, 2020, 7:07 AM

S&P 500 – [ Crash? Stress? Distress? Let’s Confess, No One Can Predict A Crash, Our Two Cents Worth]

Image source: kennofinanical.com

SALE SALE SALE!! haha..nah kidding! Are you worried, stress or unsure of what to do? We’ll just share our two cents worth on the current market and why this time might be a good opportunity to enter the market if you’re investing.

Market is currently jittery with a few possible reasons.

  1. Record number of Covid cases in the US, White house seems to have given up on fighting covid. Lockdowns are happening in Europe, will US also impose lockdowns?
  2. Stimulus Package. As usual, talks and talks about stimulus, delays anticipation all these adds to the volatility.
  3. ELECTIONS! It’s just round the corner! Market gets jittery around this period and volatility ensue.

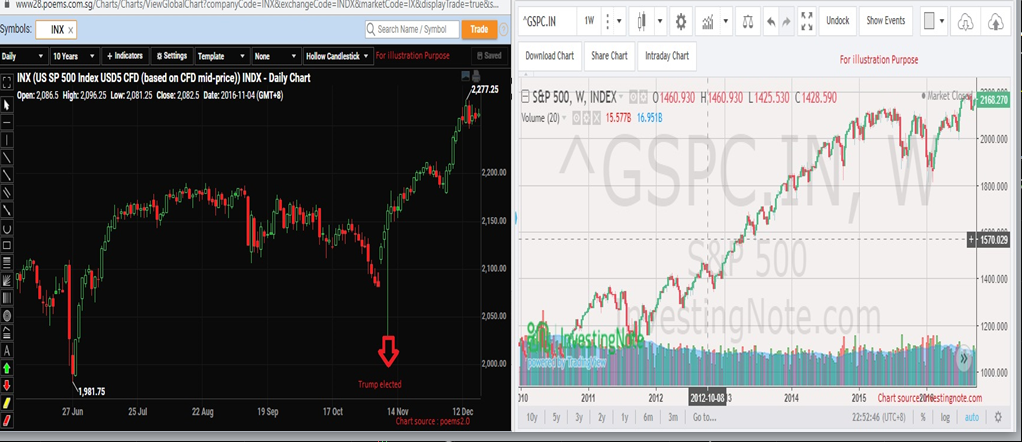
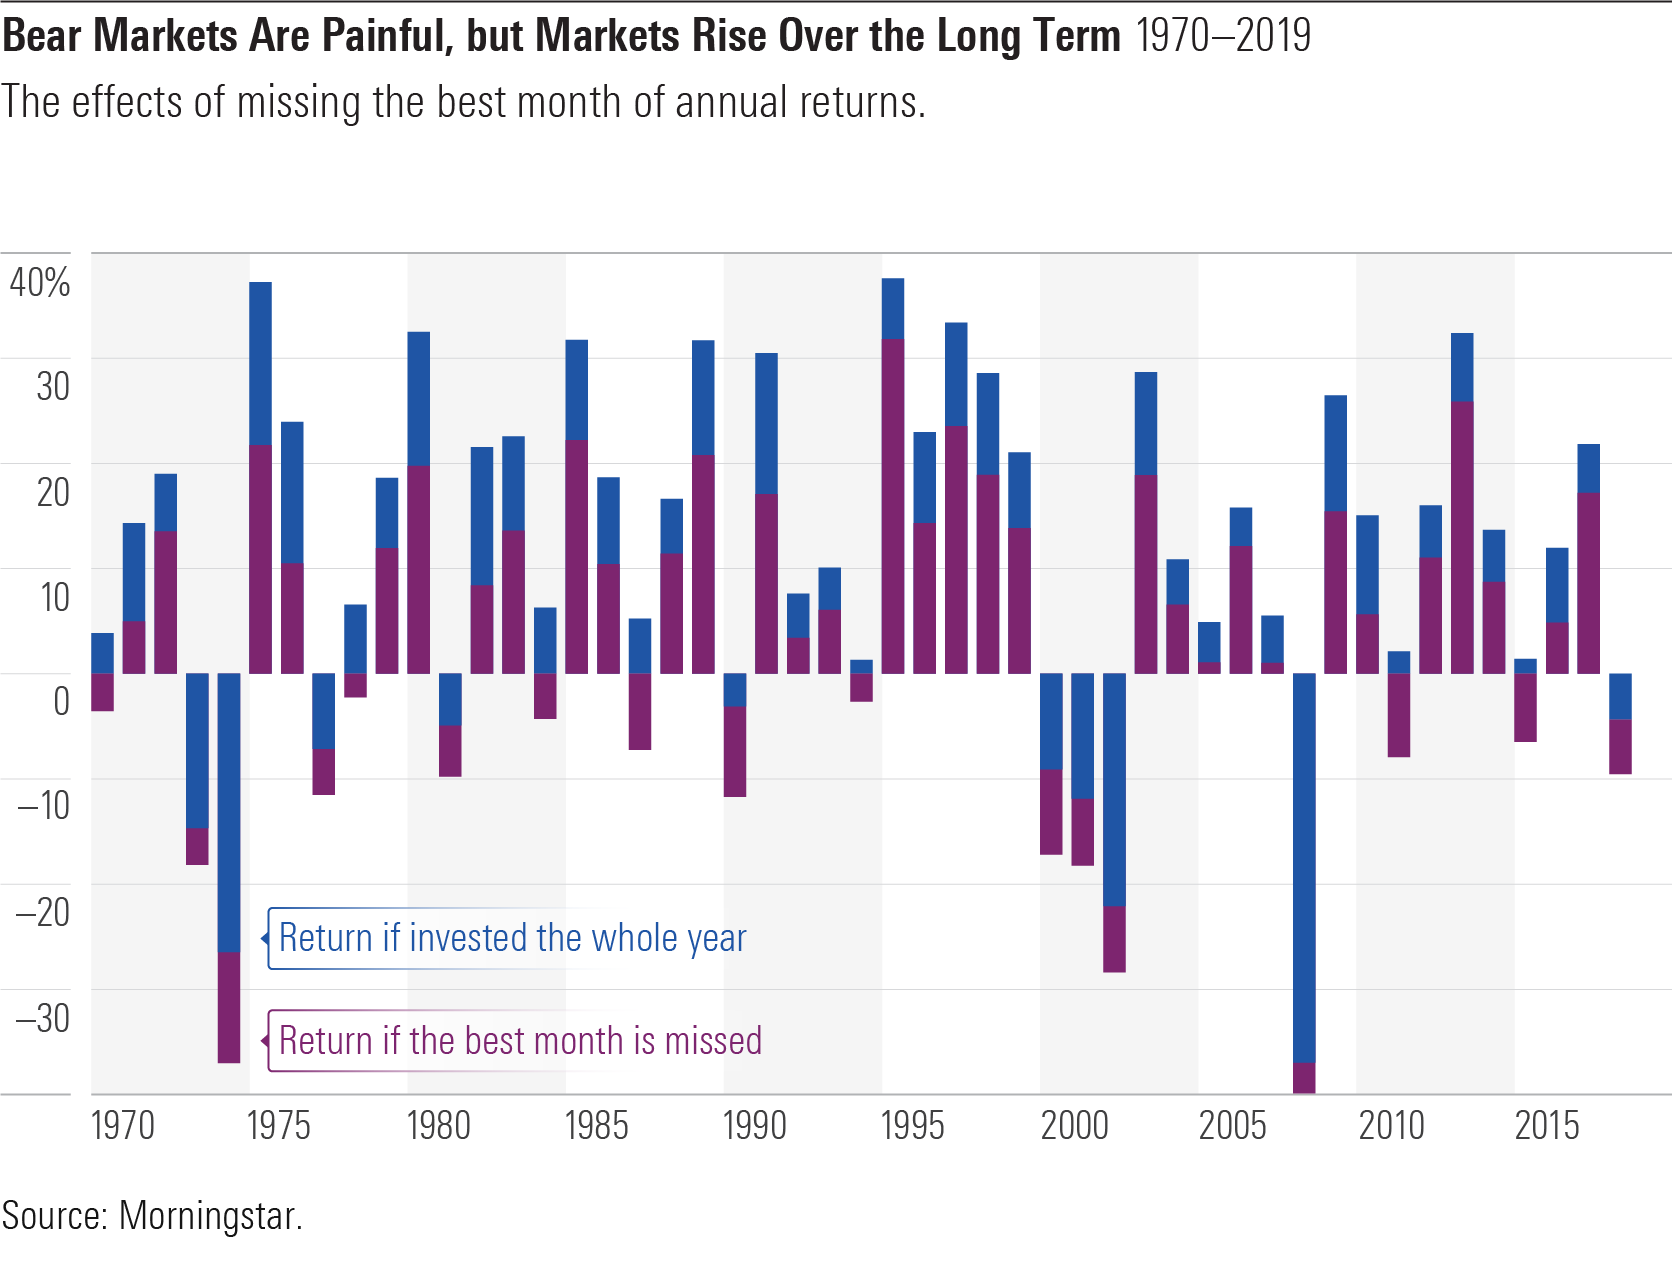
As we have pointed out a few times, the weeks before election can get bumpy and even on the day itself and the day after as market reacts to the news. But from stats, we can see that regardless of who wins, market tends to go up after all the noise.

Let’s now take a look at the S&P chart to see where it might head to

S&P 500 30th Oct 2020

Chart source: poemsview 30th oct 2020

From a technical point of view, S&P is currently below the 100ema which is not a good sign but no need to panic yet. The next support would be at the 200ema at around 3200 level. Worst case scenario might be to 3132 level. Currently, S&P500 is still considered in an uptrend as the emas have yet to cross. If the 20ema cross the 50ema then the first red flag will come out. A further cross of the 100em would be our second red flag and we’ll really have to re-look at the market then.

For long term investors, this might present some opportunities for entry with a stagger system and not entering by one whole batch. We usually enter around 3-4 batches for one stock. For investing, don’t try to time the bottom as from past experience its almost impossible to do that.  If you’re a firm believe in that markets go up in the long run then you might want to take a look at the markets very soon. ( not all markets ya, be selective! ) We’re eyeing the S&P500! Have your shopping list ready! We have ours! Do you??

We’ll share more of some of the stocks we’re looking at in the next few post! Keep a look out!

Yours

Humbly

Kelwin&Roy

Sembcorp Industries – [ $1.55 Target Hit! Next Target?? ]

27th October, 2020, 5:57 PM

Sembcorp Industries – [ $1.55 Target Hit! Next Target?? ]Sembcorp Industries 27th Oct 2020

Chart Source: Poemsview 27th Oct 2020

Sembcorp Industries gave us a pleasant surprise and moved up over 4.5% to hit our target of $1.55 just a day after we posted. Once again it bucked the overall trend and emerged top for the STI component.

So now that $1.55 has been hit, what’s our next target? We’re looking at $1.60 then $1.64 but of course not overnight unless Sembcorp Industries decides to surprise us! It’s good to learn how to swing your trade using CFD and not overtrade by going in and out. Learning to have a trailing stop is also important in order to ride your trade. The 10ema would be our support for now.

One suggestion might be the breakout point of $1.46 as ur trailing stop or maybe even $1.50 if u want to protect more of your profit. Remember to always take some profits off the table so you can utilize your funds too.

Want to cut through the noise and get such trade alerts straight to your handphone?

Then be our EXCLUSIVE CLIENT and find out how much value is waiting for you!

See you onboard soon!

Yours

Humbly

Kelwin&Roy


Gold – [ Let’s Talk More About It And Where It Might Be Heading Towards Part 1 ]

27th October, 2020, 7:07 AM

Gold – [ Let’s Talk More About It And Where It Might Be Heading Towards Part 1 ]

Chart Source: Poemsview 27th Oct 2020

GOLD! I’m sure most of us are not stranger to that word and have some interest in it. Gold is generally consider a safe-haven asset whenever markets are volatile and uncertain. The demand for gold is usually driven by market instability. We can see how much gold has risen ever since covid-19 hit causing one of the greatest rally in gold. Gold usually has a negative correlation to other assets like stocks and bonds but in recent times are we see US market trend up, gold has been on a steady climb. So remember to watch the charts and not just listen or read information without looking at the charts.

So are we too late into the gold rush? Let’s take a look at the charts to help us answer that. Currently gold is in a consolidation. With a lower support at around $1850 and and upper range of around $1931. Its below its 20 & 50ema of around $1907 so moving up above it is a first positive sign. It is also slightly below the short term uptrend line but regaining its foot above it at around $1914 would be another positive sign.

Biden and gold. So what will happen if Biden wins the US election? His plan for a huge stimulus might see gold prices moving up. Bigger stimulus might cause a weaker USD in the near term and has money is being pumped into the system inflation might start to creep in. Gold is usually a hedge for these events and we might even see gold retesting the high of $2000.

Next question would be how to invest in gold? We’ll cover some ways to invest in gold in our next blog post so stay tune!

Meanwhile, keeping a close watch on gold.

Yours

Humbly

Kelwin&Roy

SATS – [ Skies Are Opening Up! But Not Clear Skies Yet ]

21st October, 2020, 6:45 AM

SATS – [ Skies Are Opening Up! But Not Clear Skies Yet ]

Chart Source: Poemsview 21st Oct 2020

SATS has caught our attention since early Aug when covid cases started to stabilize and when it was trading at around $2.84. Talks were in place for travel to restart too. Singapore has been doing keep covid cases at bay with an average of 1-2 cases in the community which is  giving travelers some confidence. Phase 3 could be on the cards by year end too!

More good news as Singapore is firming up talks on travel to HK while SIA is also opening up its non-stop flight to NYC. More flights are opening up to Australia too. Cruise to nowhere is also starting next month and all these restarts are good for the badly beaten SATS. Yes, travel demand is not going through the roof yet, but countries are taking the right steps in trying to open their tourism industry.

From a technical perspective, Sats is currently above the 100ema which it hasn’t cross in awhile so this is a positive sign to us. It recently tested this support which is also the downtrend line which we drew which showed strength and could bounce back up. Immediate resistance we see is at $3.14-3.15 once that is cleared we might even it challenge the 200ema in the coming weeks.

Keeping a close watch on SATS

Yours

Humbly

Kelwin&Roy

ISDN – [ Broke Out? Can It Move Up Further? ]

20th October, 2020, 1:16 PM

ISDN – [ Broke Out? Can It Move Up Further? ]ISDN 20th oct 2020

Chart source: Poemsview 20th oct 2020

ISDN looking good as it has broken above its horizontal resistance of $0.415 with some volume.

Could it stage more upside? It tested the $0.415 resistance just a few days back but failed to break it. From a technical analysis point of view, today seems a little different as it gapped up came back down to test the support and is back up now. If it manages to stay above this resistance turn support we might see more upside.

We have drawn the support and resistance levels for ISDN, keeping a lookout! Don’t forget election is around the corner. So always have a trade plan!

Yours

Humbly

Kelwin&roy

Sembcorp Industries – [ Bucking The Overall Trend Today, More Possible Upside? ]

15th October, 2020, 5:26 PM

Sembcorp Industries – [ Bucking The Overall Trend Today, More Possible Upside? ]


Chart Source: Poemsview 15th Oct 2020

Sembcorp Industries one of the rare few counter that buck the downtrend and closed positive. In fact, it’s the highest percentage gain within the STI component for today.

We’re glad we managed to catch Sembcorp Industries just before it broke out alerting our EXCLUSIVE CLIENTS on Monday when it was trading at $1.34. A nice 10 cents upside which is about 7.5% in a week is a good trade to us! Could Sembcorp Industries continue its run? We think it might be possible given that its strong in a weak market, there is volume coming in and it closed above the $1.40 horizontal resistance.

Our next possible upside is $1.47. But do be cautious, elections is in about 3 weeks, so things could start to get volatile again.

Want to cut through the noise and get such trade alerts straight to your handphone?

Then be our EXCLUSIVE CLIENT and find out how much value is waiting for you!

See you onboard soon!

Yours

Humbly

Kelwin&Roy

Frencken – [ What’s Our Next Target? $1.10 Possible? ]

14th October, 2020, 6:50 AM

Frencken – [ What’s Our Next Target? $1.10 Possible? ]Frencken 14th Oct 2020


Chart Source: Poemsview 14th oct 2020

Frencken has seen a nice upside in the recent week after it broke above its 20ema. We’re glad we managed to alert our EXCLUSIVE CLIENTS when it was trading at $0.98. It moved up after but didn’t move  as much as expected but as we waited our patience paid off.  A nice 10% upside in two weeks is good to us as we continue to value add to our clients.

So what’s next for frencken? Will it be able to hit $1.10? Using technical analysis $1.10 is within grasp but we would prefer to take some profits off the table as some pullback and consolidation might be possible before it gathers strength to test $1.10 and maybe even $1.14!

Want to cut through the noise and get such trade alerts straight to your handphone?

Then be our EXCLUSIVE CLIENT and find out how much value is waiting for you!

See you onboard soon!

Yours

Humbly

Kelwin&Roy


Ascendas Reit – [ What Has It Broken Out From? ]

13th October, 2020, 5:10 PM

Ascendas Reit – [ What Has It Broken Out From? ]

Ascendas Reit 13th Oct 2020

Chart Source: Poemsview 13th Oct 2020

Ascendas Reit is a business space and industrial reit which i’m sure many would have seen their spaces all over Singapore. It is also part of the STI component. The Singapore portfolio includes Business and Science parks, High specs industrial & Data Centres. In 2019  ,Ascendas REIT acquired 28 business park properties in three growing US tech-cities. High-specs industrial and data centres make up 17% of its portfolio; with ICT customers contributing 9%, and data centres contributing 5%, to its monthly gross revenue. Data centres like we mentioned in our previous post of Keppel DC Reit is a hot asset in the market. Though Asecndas Reit is not a direct play its good to have a mix of it.

It’s dividend yield is around 4.9% which is decent. So let’s look at it from a technical analysis perspective.

It has broken above its 20 and 50ema which is a positive sign. If you look back, these two moving averages as been acting as the resistance and finally today it managed to break above it. Volume came in too as we can see it’s higher than the last few days. These are positive signs to us.

We have drawn some of the support and resistance level and we might see $3.40 in the coming weeks.

Keep a close watch!

Yours

Humbly

Kelwin&Roy


Keppel DC Reit – [ What Are The Chances Of Testing Previous High? ]

13th October, 2020, 7:07 AM

Keppel DC Reit – [ What Are The Chances Of Testing Previous High? ]Keppel DC Reit 13th Oct 2020

Poemsview : 13th Oct 2020

Keppel DC Reit is an unique asset class on its own and it’s the first pure-play data centre REIT listed in Asia on SGX.

Data centre has been a hot asset and keppel DC Reit has been a beneficiary of it.

From a dividend yield Keppel DC Reit isn’t that attractive of around 2.5% due to the vast increase in price but due to its strong name and financial standing it might be still worth looking at it.

From a technical point of view, it could be in a range with support being at $2.87and the upper limit at $3.07. It has stayed above the 20ema which is a positive sign. What would be good is that the volume could have been more which could indicate a sustained uptrend. Nonetheless, we think Keppel DC Reit stands a good chance to test $3.07 in the near future. It consolidated for the last two weeks and a push to $3.07 could be on the cards. Would prefer a swing for this counter.

Let’s keep a close watch!

Yours

Humbly

Kelwin&Roy