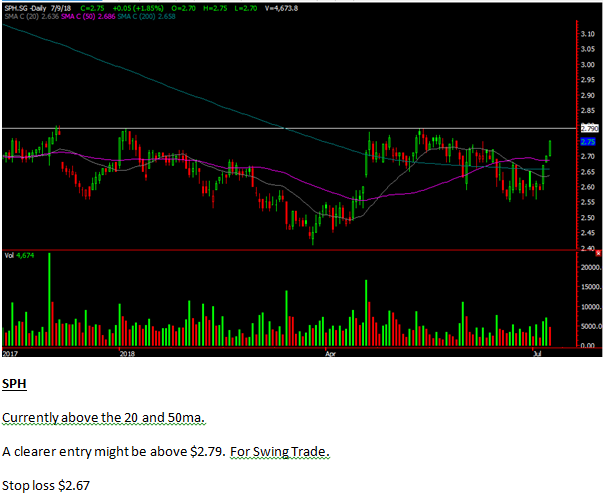
SPH – [Closed Day High, Second Target Achieved, Next Target? ] 
Chart Source : Poemsview 19th July 2018
SPH up 4% since our entry of $2.80. Volume looks healthy as traders started pouring in today.
But of course our EXCLUSIVE CLIENTS were alerted earlier on of SPH when it was trading at $2.79.
SPH closed right at $2.92 where we mentioned in our previous post. A break above that might see it reach our next target of $2.99.
We would want to put a trailing stop now since SPH has ran up.
Want to be part of this EXCLUSIVE CLIENT Group?
Want to be informed in advance of such trade analysis in order to plan and prepare?
Then be Kelwin & Roy’s client to enjoy such value added services.
Don’t miss out further!
Yours
Humbly
Kelwin&Roy


![Straits Times Index – [ More Updates And Game Plan After Trump Announced Tariffs on $200B More Chinese Goods]](http://singaporehumblestock.com/wp-content/uploads/2018/07/STI-1.png)