Valuetronics – [ Lower High On Each Rebound, What’s Next?]
Chart Source: Poemsview 20th March 2019
Valuetronics together with the other electronic stocks had a retracement after having a decent run up over the last week.
Valuetronics has caught our attention for some of the reasons below.
- Its rebound is lower than the previous rebound at $0.74
- Valuetronics is below its uptrend line now.
- Valuetronics is near the horizontal support of $0.68. A break below that might signal more downside.
- Valuetronics is also below its 20ema
With these reasoning Valuetronics is now on our radar. A break below that $0.68 might have more downside.
Is Valuetronics on your watchlist?
What’s your trade plan for Valuetronics like?
It is important to have a sound and actionable trade plan in order to be discipline in your trades.
CLICK HERE to see how you can learn how to plan a sound and actionable trade plan and to be part of this EXCLUSIVE COMMUNITY to enjoy such value added services.
Yours
Humbly
Kelwin&Roy


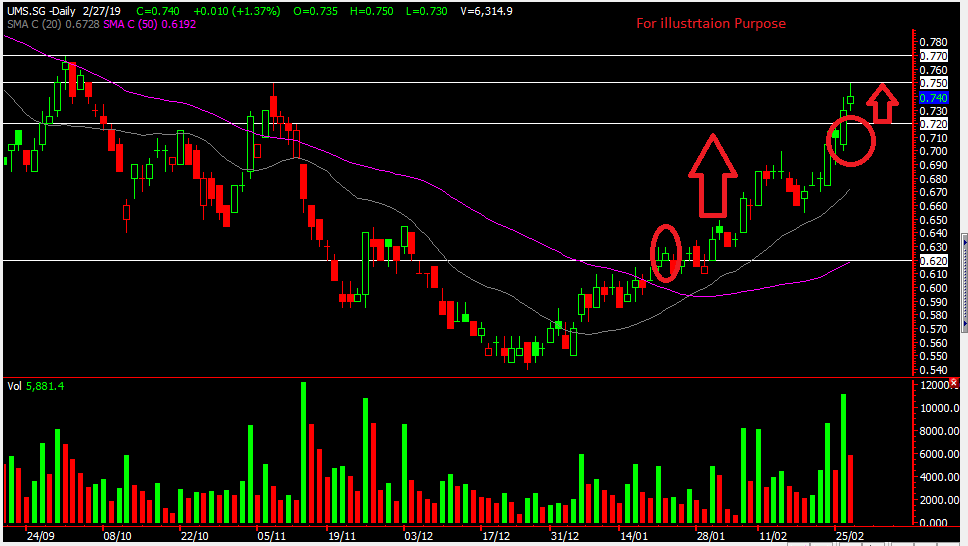


![UMS – [ Riding Along With The Electronic Rebound, Anymore Upside? ]](http://singaporehumblestock.com/wp-content/uploads/2019/02/ums-2.png)