OCBC – [ Second Target Met, The Importance of Taking Profit]

19th February, 2019, 10:29 PM

OCBC – [ Second Target Met, The Importance of Taking Profit]OCBC 19th Feb 2019

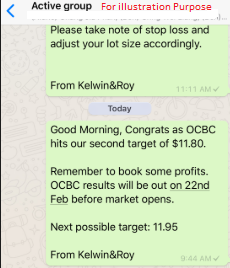
Chart Source : Poemsview 19th Feb 2019

OCBC continued it move up today meeting our second target of $11.80 as blogged last night. What was interesting is that at around that point ($11.80) OCBC started showing weakness. The resistance at $11.80 proved strong and OCBC couldn’t break above that and succumb to profit taking.

Once again we’re glad that we alerted our EXCLUSIVE CLIENTS to also take some profit off the table since our second target has been met. Our EXCLUSIVE CLIENTS were alerted when OCBC was trading at $11.60 just LAST WEEK with an impending breakout and we’re glad our second target was met.

Reminder that OCBC results will be coming out very soon. Will this retracement be a chance for entry?

It is important to manage your trade and let your winning trade run while protecting the downside. Ever wonder how to come up with a sound and actionable trade plan?

CLICK HERE to see how you can learn how to plan a sound and actionable trade plan and to be part of this EXCLUSIVE COMMUNITY to enjoy such value added services.

Yours

Humbly

Kelwin&Roy

OCBC- [ First Target Hit, Running Ahead Of Results, What Should We Do Now?]

18th February, 2019, 4:15 PM

OCBC- [ First Target Hit, Running Ahead Of Results, What Should We Do Now?]OCBC 18th feb 2019

Chart Source: Poemsview 18th Feb 2019

OCBC continues it move up as DBS released its set of results that was slight below analyst expectation. Despite the slightly lower expectation DBS managed to move up with some gains.

Focus is now on OCBC and UOB as they are slated to report their results on 22nd Feb before market open.

OCBC moved up this morning to our first target of $11.71 up from our entry at $11.59. A nice upside for our first target. Our second target is at $11.79. As results are coming out soon there are a few things to note.

  1. Be careful when trading near results as any surprise could mean an unexpected move in price
  2. Near Term resistance at $11.79-11.80
  3. Support at $11.35
  4. Forward statement of CEO would be crucial as a bleak outlook might cause a turn in trend.

Our EXCLUSIVE CLIENTS were alerted early in advanced in order for them to PLAN, PREPARE and PROCEED with ease. We’re glad that our first target has been met and we can be clear headed going into results.

What’s your trade plan for OCBC like?

Want to receive such analysis to straight to your handphone?

Want to be our EXCLUSIVE CLIENTS to receive such value added services?

CLICK HERE to see how you can be part of this EXCLUSIVE COMMUNITY to enjoy such value added services.

Yours

Humbly

Kelwin&Roy

SIA Engineering – [ At Support Now, What Does The Chart Says? ]

28th January, 2019, 10:25 PM

SIA Engineering – [ At Support Now, What Does The Chart Says? ]SIA Engineering 28th Jan 2019

Chart Source: Poemsview 28th Jan 2019

SIA Engineering seen an increased in volume today and closed at its horizontal support of $2.50. A break below it might see more downside.

It is also currently supported by its short term uptrend which kind of coincides with the horizontal support. So if these break we’ll be watching for a short.

Want to learn how to short using Poems CFD? Instead of trying to bottom pick, a trader could use the downside to his advantage by shorting.

We’ll be having a CFD workshop to go through the usefulness of using this  instrument and how critical it is in the coming months.

It’ll be held this coming Wednesday (30th) Jan and more details can be found in the link below.

https://www.eventbrite.sg/e/skillfully-long-or-short-the-market-using-cfds-in-any-market-condition-tickets-55063997900

See you all there!

Yours

Humbly

Kelwin&Roy

Sembcorp Industries – [ A Quick Short After Breaking Down, At The Support Now? ]

24th January, 2019, 3:10 PM

Sembcorp Industries – [ A Quick Short After Breaking Down, At The Support Now? ] Sembcorp Industries 24th Jan 2019

Chart Source: Poemsview 24th Jan 2019

Sembcorp Industries currently one of the top losers in the STI component had some retracement after moving up since December.

In fact, looking back we’re glad we managed to catch that upside.

And for now as Sembcorp Industries hit some resistance it started to retrace and has now hit our first downside target of $2.62.

Our EXCLUSIVE CLIENTS were informed of this trade analysis for them to Plan, Prepare and Proceed.  Sembcorp Industries currently is at our short term uptrend line support, breaking it might see more downside.

What would your trade plan be?

Are you prepared for the eventual outcome?

Want to be part of this EXCLUSIVE COMMUNITY  to help guide and prepare for market.

Don’t wait and CLICK HERE to see how you can join this community and all the exciting perks of being a Client of Kelwin&Roy

Yours

Humbly

Kelwin&Roy

Venture – [ Hitting Resistance? What Does The Chart Say?]

23rd January, 2019, 3:21 PM

Venture – [ Hitting Resistance? What Does The Chart Say?]Venture 23rd Jan 2019

Chart Source: Poemsview 23rd Jan 2019

Venture part of the STI component stock moved up this morning but hit a roadblock at the $15.64 area. It didn’t manage to break that and started retracing.

Venture is on our watchlist as it might start to pullback since it can’t break the resistance.

Our uptrend line is drawn too as a support and if that breaks we might also see a pullback. Only thing about Venture is that its a relatively thin stock. So it can be quite volatile at times.

What’s trade plan for Venture?

Want to know more about Venture? And what we’re

SATS – [ Hitting Our Downtrend Line, Biggest Loser Of The STI Component, Lets See The Chart]

18th January, 2019, 5:34 PM

SATS – [ Hitting Our Downtrend Line, Biggest Loser Of The STI Component, Lets See The Chart]SATS 18th Jan 2019

Chart Source : Poemsview 18th Jan 2019

SATS is part of the STI component stock and is the leading provider of gateway services and food solutions in the region.

SATS had a nice rebound from around $4.56 to a high of $4.97 which also coincides with our downtrend line that we drew. After moving up that much it was time for a break for SATS and true enough the pullback came.

Our EXCLUSIVE CLIENTS were alerted, so that they could plan, prepare and proceed.

SATS came sliding down today and was the top loser despite STI closing positive. What a way to end the week. For now our first target $4.80 has been hit and if it closes below $4.80 we might see further downside to our second target as drawn on the chart.

Were you alerted of this trade analysis?

Want to be part of this EXCLUSIVE COMMUNITY to enjoy such value added services?

Don’t wait and CLICK HERE to see how you can join this community and all the exciting perks of being a Client of Kelwin&Roy

Yours

Humbly

Kelwin&Roy


DBS – [ Up Over 4% And Retraced After Hitting Our Resistance, Next Stop?]

14th January, 2019, 5:38 PM

DBS – [ Up Over 4% And Retraced After Hitting Our Resistance, Next Stop?]DBS 14th Jan 2019

Chart Source: Poemsview 14th Jan 2019

DBS part of the 30 STI component stocks saw a nice upswing over the past week.

We’re glad we managed to catch this upswing to a nice tune of 4% within the week from $23.84 to $24.89

Our *EXCLUSIVE CLIENTS* were alerted of this trade analysis with the chart attached for easier reference.

DBS has hit our resistance of $24.89 and started retracing to a low of $24.50. Further retracement might be seen to $24.40 level and if that can’t hold more downside might be seen.

What’s your trade plan for DBS?

Want to be informed of such trade analysis?

Don’t wait and CLICK HERE to see how you can join this community and all the exciting perks of being a Client of Kelwin&Roy

Yours

Humbly

Kelwin&Roy


SIA Engineering – [ Bottoming Out? Keeping A Lookout]

6th December, 2018, 8:45 AM

SIA Engineering – [ Bottoming Out? Keeping A Lookout] SIA Engineering 7th Dec 2018

Chart Source: Poemsview 7th Dec 2018

Sia Engineering part of the STI component stock has recently taken a beating as its results back in Nov wasn’t what market expected. Its core operating margins falter again which led to disappointing results.

But after the beating, SIA Engineering seems to be holding well at the $2.48 horizontal support level. A brief broke down of that support happened this morning and it managed to recover and close above the support. A good sign to us and we’ll be watching closely to see how SIA Engineering will perform in the coming days.

Near term resistance might be at $2.59.

What’s your trade plan for SIA Engineering?

It is crucial to have a proper and sound trade plan with the right risk reward ratio in order to beat the market.

CLICK HERE to see how you can develop a sound and actionable trade plan which we share to our community.

Yours

Humbly

Kelwin&Roy

Sembcorp Industries – [ Catching Near Bottom, Hitting Our $2.75 Resistance, Anymore Upside?]

4th December, 2018, 5:19 PM

Sembcorp Industries – [ Catching Near Bottom, Hitting Our $2.75 Resistance, Anymore Upside?]Sembcorp Industries 4th Dec 2018

Chart Source: Poemsview 4th Dec 2018

Sembcorp Industries another oil related stock and part of the STI component stock had a nice run just like Sembcorp Marine.

We’re glad that we managed to alert our EXCLUSIVE CLIENTS when Sembcorp Industries was near the bottom at $2.64. A nice run up came shortly hitting our $2.75 target.

Currently Sembcorp Industries is being resisted by the horizontal resistance at $2.75 and also the 50ema. A break above that might see it move up to $2.82.

Opec meeting is just around the corner and market is awaiting for oil production to be cut. Will Opec cut? How much will they cut their production by? How will this impact the oil market?

Has oil stocks ran ahead of Opec meeting? What if OPEC fails to deliver?

What would your trade plan be?

Are you prepared for the eventual outcome?

Want to be part of this EXCLUSIVE COMMUNITY  to help guide and prepare for market.

Don’t wait and CLICK HERE to see how you can join this community and all the exciting perks of being a Client of Kelwin&Roy

Yours

Humbly

Kelwin&Roy


SATS – [ Caught It Near Bottom At $4.67, Up 4% In Less Than A Week, Where To Now?]

3rd December, 2018, 10:20 PM

SATS – [ Caught It Near Bottom At $4.67, Up 4% In Less Than A Week, Where To Now?] SATS 3rd Dec 2018

Chart Source: Poemsview 3rd Dec 2018

Another stock that was on our radar was SATS. SATS part of the STI component stock and  is the leading provider of gateway services and food solutions in the region. An evolution that has been the result of our commitment to delight customers and enable their success.

We’re glad we spotted SATS very near to the bottom and of course our EXCLUSIVE CLIENTS were alerted! From the trendlines and pattern we observed that whenever SATS hits that bottom trendline it tends to bounce up fiercely. We’re glad that turned out well and the rebound came. SATS moved up 4% since our entry at $4.67 and have now come to a resistance.

A break of that resistance might see it move up to $4.97.

Want to be part of this EXCLUSIVE COMMUNITY  to help guide and prepare for market.

Don’t wait and CLICK HERE to see how you can join this community and all the exciting perks of being a Client of Kelwin&Roy

Yours

Humbly

Kelwin&Roy