UMS – [Rebound In Progress, Some Of Our Targets ]

11th March, 2021, 9:45 PM

UMS – [Rebound In Progress, Some Of Our Targets ]UMS 11th March 2021

Chart source: Poemsview 11th March 2021

UMS saw a nice rebound today hitting our first target of $1.15. A bullish closing today at the day high might signal more upside to come. Potential gap resistance at $1.18 first and then our next target of $1.20. Electronic stocks have been oversold despite posting results in line with analyst. So a rebound to cover the gap to around $1.24 might be reasonable. Keeping our fingers crossed.

Will update more on AEM as it has rebounded too from our previous post

Want to cut through the noise and get such trade alerts straight to your handphone?

Then be our EXCLUSIVE CLIENT and find out how much value is waiting for you!

See you onboard soon!

Yours

Humbly

Kelwin&Roy

Sembcorp Industries – [ Two Good Months, Can It Still Push To Its Recent Peak? ]

9th March, 2021, 6:07 PM

Sembcorp Industries – [ Two Good Months, Can It Still Push To Its Recent Peak? ]Sembcorp Industries 9th March 2021

Chart Source: Poemsview 9th March 2021

Sembcorp Industries saw an increased in volume today which is one of the highest over the last 4 months. With this increase in volume we might see a test of the recent peak of around $1.87 given such a strong volume. Some resistance might be met around that area and if we managed to clear that we might see a push to $1.95 area.

So far Sembcorp Industries has been good to us on both occasion as shown above. Find out how you can swing your trades using Poems CFD to ride out a trend!

Want to cut through the noise and get such trade alerts straight to your handphone?

Then be our EXCLUSIVE CLIENT and find out how much value is waiting for you!

See you onboard soon!

Yours

Humbly

Kelwin&Roy

AEM – Is A Rebound Insight? When Will The Selling End?

9th March, 2021, 7:27 AM

AEM – Is A Rebound Insight? When Will The Selling End? AEM 9th March 2021

Chart Source: Poemsview 9th March 2021

AEM has recently been sold down over 20% when funds started to shift out to more value stocks. Despite research reports maintaining a buy on AEM, AEM continues to sell down causing investors to think twice about touching it.

Lets look a little closer at AEM and its recent results. Its FY20 revenue/net profit was in line with consensus. Balance sheet remains in a net cash position. It announced another acquisition to strengthen its system level test capabilities.

And now lets take a look at the technical chart. AEM has corrected about 20% sine the peak. A horizontal support of around $3.66 might provide some support and our next support might be around the 200ema of around $3.50. A rebound might be in sight after such a fall as bargain hunters are on the lookout at current price. A nimble bite at this current price is what some investors might consider doing. As for traders, we’re looking for a bullish candle off the support level or even a break above the 5ema (highlighted by the yellow line) before an entry. As we can see, the 5ema as been acting as the resistance and so far AEM cannot break through that.

What are your thoughts? Will AEM continue to fall even more? Lets us know!

Yours

Humbly

Kelwin&Roy

Straits Times Index – [ In The Midst Of A Pullback And Here’s What We Did Last Week!]

29th January, 2021, 7:14 AM

Straits Times Index – [ In The Midst Of A Pullback And Here’s What We Did Last Week!] Straits Times Index 29th Jan 2021

Chart Source: Poemsview 29th Jan 2021

Straits Times Index currently having a pullback from a high 3017 which might have come as a surprise for some but we’re thankful that our EXCLUSIVE CLIENTS were warned of this pullback last week. STI had moved up over 5% since the start of Jan and along with other  markets it looked tired and was tough to push higher. True enough some pullback came which is healthy in our view.

We have drawn some support levels for the STI with the 50ema of around 2866 being our major support. Support levels might present chance to scale in for long term stocks.

Want to have such updates sent to your handphone straight?

Then be our EXCLUSIVE CLIENT and find out how you can be included in our trading community.

See you onboard soon!

Yours

Humbly

Kelwin&Roy

IFast -[ Broke The All Time High, Reviewing This Trade And How To Trail Your Profit Levels

19th January, 2021, 7:15 AM

IFast -[ Broke The All Time High, Reviewing This Trade And How To Trail Your Profit Levels IFast 19th Jan 2021

Chart Source: Poemsview 19th Jan 2021

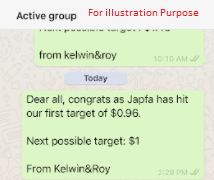
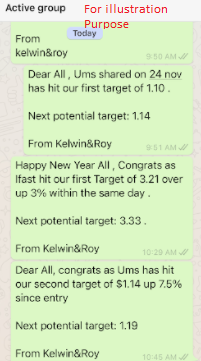
It’s a very good start for IFast as it has seen its price rocketed over 50% since its opening price of $3.06 and a closing of $4.67 as of 17th Jan. Unbelievable and rare to find in the Singapore stock market. We’re just glad that we managed to catch this stock from the start of this year and starting the year on the right foot.

Many have asked what’s the outlook for IFast, how much further can it go? Can still enter? We’ll try to share as much so hopefully you’ll have a better perspective on how we look at the markets.

For a start, we’ll be honest and admit that we didn’t expect IFast to run that much and that fast. That I think most people wouldn’t be able to tell. But what we can share if how we can go about tackling such trades. Firstly, a look at the company’s fundaments to see if such a stock might be worth trading or even holding. IFast had an impressive track record so far and is a growing company with a growing asset under its arm. Something which we mentioned in our blog post. 

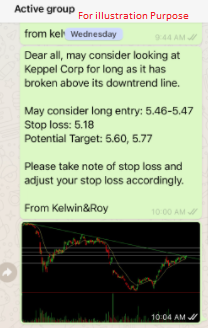
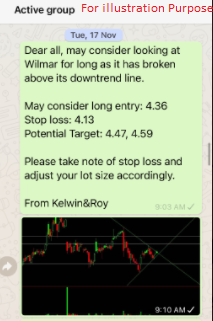
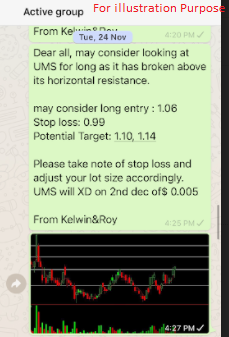
Secondly as we enter a trade and as it hits our target, one can either take profit or start placing a stop loss at the entry point once the stock has hit our second target. If it has moved further set it to the second target as ur trailing stop loss. One might also consider using the 5ema as a guide when a stock starts displaying a powerful uptrend like IFast. It is an illusion to think that one can always take profit at the top. Sorry to burst your bubble, even after more than 10 years of trading we still can’t take profit at the top of the top. =)

Thirdly, decide if you’re trading or investing. If you can’t decide why you’re entering the trade or the answer is I don’t know or I everything then you’re probably going to end up with very mixed results. Trading and investing are two very different things and mixing it up usually will result in very mixed results. When you’re suppose to hold you sell, when you’re suppose to sell you hold. So make up your mind, be clear in your actions.

We hope we shed some light for trading such stock . From the chart, we can see that IFast touched the 5ema and started having some rebound. If it closes below the 5ema for more than two -three days then it might signal more downside if not continue to enjoy the trend.

Want to cut through the noise and get such trade alerts sent straight to your handphone? In addition, have such a detailed follow up?

Then be our EXCLUSIVE CLIENT and find out how you can be included in our trading community.

See you onboard soon!

Yours

Humbly

Japfa – [ Late Day Break Out, All Time High In Sight]

18th January, 2021, 6:50 PM

Japfa – [ Late Day Break Out, All Time High In Sight]
Japfa 18th Jan 2021

Chart Source: Poemsview 18th Jan 2021

Japfa saw some action creeping in after lunch break and at around 3pm some heavy buying started appearing. We’re glad we didn’t need to chase or do much as our EXCLUSIVE CLIENTS were alerted last Tuesday when we saw a break of the horizontal resistance as shown above in the message.

So we were just waiting for it to hit our first target right at the previous high of $0.96. A nice hit and it continued to push on breaking this resistance. Volume also started and its higher than the past few days which is a positive sign for us. Its closing is also above the resistance of $0.96 another positive sign. Will Japfa be able to challenge the all time high of $1.05? This might be on the cards with the healthy volume but we’re aiming for $1 first as there might be some profit taking around that area. Fingers crossed!

Want to cut through the noise and get such trade alerts straight to your handphone?

Then be our EXCLUSIVE CLIENT and find out how to be included in our trading community right now!

See you onboard soon!

Sign up on our mailing list to receive the latest news and blog updates too!

Yours

Humbly

Kelwin&Roy

Sembcorp Industries – [ Pushing Upwards, Looking For A Further Break ]

13th January, 2021, 7:05 AM

Sembcorp Industries – [ Pushing Upwards, Looking For A Further Break ]Sembcorp Industries 13th Jan 2021

Chart Source: Poemsview 13th Jan 2021

Sembcorp Industries bucking the overall down day in the STI to come up as one of the top gainers yesterday.

Will the trend continue? Lets take a look from a technical perspective. Sembcorp Industries had a month long consolidation from Dec till Jan and started to show sign of bullishness . In fact when it broke above the 20ema together with an increase in volume just last Wednesday we saw it as a bullish sign and alerted our EXCLUSIVE CLIENTS. The breakout was at $1.74 and since then  we saw a nice upside of over 5% in a week. Does it still have legs to move up? We think its possible for it to test the $1.88 resistance then maybe a short break and try to push further to the $1.94 level which you’ll need to zoom out of the chart to have a better look. We’ve been covering Sembcorp Industries since last Oct so take a read over here to gain more knowledge about it.

Want to cut through the noise and get such trade alerts straight to your handphone?

Then be our EXCLUSIVE CLIENT and find out how much value is waiting for you!

See you onboard soon!

Yours

Humbly

Kelwin&Roy


Keppel Corp – [ Run Just Started Or Late In The Run? ]

10th January, 2021, 8:10 AM

Keppel Corp – [ Run Just Started Or Late In The Run? ]Keppel Corp 10th Jan 2021

Chart Source: : Poemsview 10th Jan 2021

Keppel Corp is part of the STI component stock and it broke out of its long term downtrend line last Wednesday which was a bullish price action for us. We alerted our EXCLUSIVE CLIENTS on this breakout and we’re glad it started to move up the next few days.

From the chart this move could have further legs as it has consolidated for around a month and we can see volume coming in the last few days too. We could use poems CFD to swing this trade to around $5.77 and if market continues its bullish we might see Keppel Corp push to $6 in the coming weeks. With Keppel Corp trying to monetise some of its $17.5 billion of assets over time might be a catalyst for further upside. It has also laid out its 2030 blueprint back in may2020 which could boost its longer term horizon. We prefer to swing this trade using poems CFD which you can learn more over HERE.

Missed the breakout for Keppel Corp? Want such trade alerts sent to your handphone straight?

Then be our EXCLUSIVE CLIENT and find out how much value is waiting for you and how you can be included in our community.

See you onboard soon!

Yours

Humbly

Kelwin&Roy


Wilmar – [ Anymore Room For Upside After Such A Strong Run?]

9th January, 2021, 6:42 PM

Wilmar – [ Anymore Room For Upside After Such A Strong Run?]Wilmar 9th Jan 2021

chart source: Poemsview 9th Jan 2021

Wilmar had a nice upside of over 20% since its base was formed around $4.2 in early December. We alerted our EXCLUSIVE CLIENTS back in late Nov when Wilmar started to show some signs of interest. Holding on to this trade saw a saw eventual upside of over 15%. In order to hold on to this trade, one could either pay up fully or consider using some leverage instrument like CFD. This enables the trader to hold on to the trade for a longer time if one feels that the stock has more upside potential.

For now lets take a look at Wilmar’s chart and see if there is more room for upside. Wilmar had been having share buy back around Nov 2020 to even in Jan which could be a reason for the recent spike in price. It has risen about 20% from December and the next potential target might be around $5.20 level.  The risk reward for now isn’t favourable in our view and would prefer for a pullback to the 5, 10ema or the uptrend support line. If we missed this trade we would prefer to wait and not chase or maybe look at another stock rather than trying to buy high and try to sell higher.

Want to learn more about CFD? We made some videos on it so just click HERE to learn more and of course if you have questions feel free to drop us a message.

Also, if you want to get such trade alerts straight to your handphone with such a follow up service,

Then be our EXCLUSIVE CLIENT and find out how much value is waiting for you!

See you onboard soon!

Yours

Humbly

Kelwin&Roy

UMS – [ Powerful Breakout Yesterday, Able To Sustain? ]

5th January, 2021, 7:00 AM

UMS – [ Powerful Breakout Yesterday, Able To Sustain? ]UMS 5th Jan 2021

Chart Source: Poemsview 5th Jan 2021

UMS a stock that we alerted our EXCLUSIVE CLIENTS back in Nov came into motion and even hit both targets in a day!

Electronics stocks like AEM, frencken all saw some movement yesterday with UMS having the biggest gain in terms of percentage. Looking at the chart, it broke out of its $1.09 horizontal resistance and power through to close at the day high of $1.15. The volume that came in yesterday is one of the biggest for the last three months something that we should take note of. With such an increase in volume we might see the uptrend resume moving towards the previous high of $1.19 and maybe even $1.25.  UMS has also been consolidating for the last 4 months so we’re hoping for more upside for this counter.

Want to cut through the noise and get such trade alerts straight to your handphone?

Then be our EXCLUSIVE CLIENT and find out how much value is waiting for you!

See you onboard soon!

Yours

Humbly

Kelwin&Roy