Frasers Cpt Tr – [ Suburban Malls Leading The Recovery ]

2nd September, 2020, 3:59 PM

Frasers Cpt Tr – [ Suburban Malls Leading The Recovery ] Frasers Cpt Tr 2nd Sept 2020

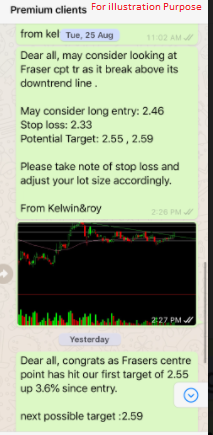
Chart Source : poemsview 2nd sept 2020

Frasers Cpt Tr is currently up after having a run up since its consolidation for the last two months. A first sign of turing up came when we saw Frasers Cpt Tr started to break above its mid-term downtrend line. It was just a week ago that we alerted our EXCLUSIVE CLIENTS of this trade set up when it was trading at $2.46 for them to prepare and plan.

Since then it has moved up over 7% since our entry and we are glad of the results.  Suburban malls looks better set for recovery as this is usually served by residences more than tourist. As tourist are not allowed for now, malls in orchard would suffer the most as lesser tourist visit. Mapletree com is also another counter for the recovery story.

As for now, Frasers Cpt Tr might see a push towards $2.72 which is closing the gap and after that a rest might be good. Will update more once again.

Want to be part of this EXCLUSIVE GROUP that were alerted of such a trade analysis?

Wait no more! CONTACT US NOW to see how you can be part of this group to receive value added service sent straight to your handphone.

Yours

Humbly

Kelwin&Roy


SATS – [ Let’s Review This Set Up Just Two Weeks Back]

25th August, 2020, 5:51 PM

SATS – [ Let’s Review This Set Up Just Two Weeks Back] SATS 25th aug 2020

Chart source: Poemsview 25th Aug 2020

SATS had some upside despite its net loss of $43.7m in 1Q20/21. This loss could be widely anticipated and it was in line with what analyst predicted. What was interesting again was that despite the negative news, SATS still climbed up yesterday.

It challenged the 50ema this morning, broke it and went to the next resistance. It has a nice upside of over 10%  since we spotted this 2 weeks back at $2.84

For now, analyst are mixed over SATS and most are anticipating some recovery with opening of some borders.

If you want to know how to swing your trade without having to go in and out. You may consider using Phillip CFD as one will not be pressured by time to sell off your position.

We use CFD in our trades to help us to swing our trade in order to ride the trend.


SATS – [ Moving Up From Yesterday’s Blog]

13th August, 2020, 7:00 PM

SATS – [ Moving Up From Yesterday’s Blog] SATS 13th Aug 2020

Chart Source: Poemsview 13th Aug 2020

SATS continued its movement seeing close to a 3% upside move from yesterday’s close. This is higher than the movement of the STI. It reached the 50ema of around $2.90 which was a resistance we mentioned just yesterday! SATS couldn’t break above it which we kind of expected as this could be a strong resistance.

If it can consolidate around this range then it might be ready to take on the next level at $3.01.

We hope you learnt something from our sharing yesterday! 

Want such analysis sent to your phone via whatsapp?

Just drop us a message and you’ll let you know how.

Yours

Humbly

Kelwin&Roy

SATS – [ Spot Anything Interesting In The Chart? ]

12th August, 2020, 7:05 PM

SATS – [ Spot Anything Interesting In The Chart? ] SATS 12th Aug 2020

Chart Source: Poemsview 12th Aug 2020

Let’s take a look at SATS, part of the STI component stock. It has once again caught our attention as it has form a small base and started to climb up. The hospitality  and aviation sector as we all know it is the weakest of all sector currently. So these plays are more suited for a rebound until a credible vaccine is found.

It tried to cross that downtrend line yesterday but failed to do so. Today it tried once again and it managed to cross and stay above the downtrend line. SATS also managed to stay above its 20ema another interesting point to take note.

The next resistance might be at the 50ema at around $2.90 first. From the chart we can see that the 50ema acts as a strong resistance and if SATS can break above this we might see some good upside.

Let’s keep watching it.

Yours

Humbly

Kelwin&roy

Capitaland – [ Landing On Our First Target, More Downside With Results Around the Corner? ]

3rd August, 2020, 6:40 PM

Capitaland – [ Landing On Our First Target, More Downside With Results Around the Corner? ]Capitaland 3rd Aug 2020


Chart Source: Poemsview 3rd Aug 2020

Capitaland together with the other big property counters like UOL and CityDev like we mentioned this morning took a dive today and closed down to near day low.

Property counters and bank counters being part of the STI component, were mainly beaten down bringing the STI down today. Capitaland actually broke its horizontal support back last week of $2.80 and did not have enough strength to regain its footing. We saw weakness when it broke its horizontal and hence alerted our CFD clients for short last week.

We’re glad that Capitaland went according to plan and hit our downside target of $2.70 a nice 3% downside in less than a week.  $2.70 might provide some support as its a round number support and also a horizontal support. Failing to hold this we might see our second target of $2.63. Continue watching it!

Want to be part of this EXCLUSIVE GROUP that were alerted of such a trade analysis?

Wait no more! CONTACT US NOW to see how you can be part of this group to receive value added service sent straight to your handphone.

Yours

Humbly

Kelwin&Roy

City Dev – [ A Bearish Trend Developing? ]

3rd August, 2020, 8:03 AM

 City Dev – [ A Bearish Trend Developing? ]City Dev 3rd Aug 2020

Chart Source: Poemsview 3rd Aug 2020

City Dev along with the other big property stocks like capitaland and UOL doesn’t seem to be performing well in the past week. It hasn’t been able to break that downtrend line and is currently resting on the horizontal support line.

With the current Covid situation, property developers might take a hit on all fronts with business slowing down in most sectors. City dev has development in many areas like residential properties, commercial, hotels which could take a hard hit during this Covid period.

If City dev breaks that horizontal support then we might see it move down to the next good support at around $7.65. The resistance would be at the downtrend line and a break above that might signal a good rebound.

Lets watch! We’re looking at more weakness first.

Want to know more about City Dev? Drop us a message!

Yours

Humbly

Kelwin&roy


Wilmar – Updates On China’s Listing, Price Started To Move Up, Next Resistance?

28th July, 2020, 6:53 PM

Wilmar – Updates On China’s Listing, Price Started To Move Up, Next Resistance?Wilmar 28th July 2020

Chart Source: :poemsview 28th july 2020

Wilmar continued its move up today partly because of some updates released regarding its China’s IPO. More about the updates can be read HERE. From our previous post, we mentioned that Wilmar might see a move up to $4.46 which is our second target. We’re glad it hit it which gave us a nice 5% upside in less than a month.

The volume traded for Wilmar is higher than the last few weeks and if Wilmar manages to stay above $4.46 we might see it move higher in the coming weeks. We’re looking at around $4.59 in which you’ll have to zoom out of the chart in order to see it. If Wilmar break below that uptrend line our upside target might not hold.

Stay alert and let’s watch!

Want to be part of this EXCLUSIVE GROUP that were alerted of such a trade analysis?

Wait no more! CONTACT US NOW to see how you can be part of this group to receive value added service sent straight to your handphone.

Yours

Humbly

Kelwin&Roy

AEM – Here’s What Happen Yesterday Before The Massive Run Up Today!

21st July, 2020, 7:00 PM

AEM – Here’s What Happen Yesterday Before The Massive Run Up Today!AEM 21st July 2020

Chart Source : Poemsview 21st July 2020

AEM took traders by surprise with an almost 20% increase today. It closed at $3.77 eventually 4 cents off the day high. An excellent upside if you ask us.

Of course let’s not talk about the upside but it’s important to know what might have led to this breakout.

Just yesterday when AEM was trading above its uptrend line, it caught our attention as we saw some strength in that. It also managed to move above the 10ema. From a technical perspective, these are signals which one must take note of. In addition, AEM is one of the stronger electronic stock in our singapore market.

As such, we alerted our EXCLUSIVE CLIENTS on this trade when AEM was at $3.15 so that they can plan, prepare and proceed. AEM closed well yesterday and there was an increase in volume too which might support a further upside. True enough we were glad our observation paid off. AEM moved  up to the $3.40 resistance and broke past it with conviction and never looked back after that. It went to a day high of $3.81 an increase of 20% since our entry.

Many are asking what might be the next target. We are looking at around $3.95 as the next potential upside if $3.80 manages to hold up. Let’s watch!

Want to be part of this EXCLUSIVE GROUP that were alerted of such a trade analysis?

Wait no more! CONTACT US NOW to see how you can be part of this group to receive value added service sent straight to your handphone.

Yours

Humbly

Kelwin&Roy

Wilmar – Coming Close To Jan’s High, IPO Hype, What’s The Plan Now?

16th July, 2020, 7:53 AM

Wilmar – Coming Close To Jan’s High, IPO Hype, What’s The Plan Now?Wilmar 16th july 2020

Chart source: Poemsview 16th July 2020

Wilmar part of the STI component stock saw a nice push up yesterday in the late afternoon. It closed up 2.1% which also nicely met our first upside target of $4.34. It was just a week back when we saw Wilmar being supported by the 5ema which we then alerted our EXCLUSIVE CLIENTS.

The listing of ts subsidiary could be one factor for this upside and another could be the general positive sentiment through the overall market.  More of Wilmar’s China IPO can be read here.

It also saw an increase in volume today too which might support the price to the next upside $4.38 and might even push it higher to our second target of $4.46.

Stay alert and let’s watch!

Want to be part of this EXCLUSIVE GROUP that were alerted of such a trade analysis?

Wait no more! CONTACT US NOW to see how you can be part of this group to receive value added service sent straight to your handphone.

Yours

Humbly

Kelwin&Roy

Capitaland – [ Landed On Our First Target, Next Target? ]

2nd June, 2020, 6:55 PM

Capitaland – [ Landed On Our First Target, Next Target? ]

Capitaland 2nd June 2020

Chart Source: Poemsview 2nd June 2020

Capitaland came in the top 3 in terms of percentage gain.  It trailed slightly behind SATS and SIA which both also had a good showing and finished up 5.72%. Market was strong overall partly due to the end of circuit breaker and gradually opening up the economy.

From the chart we can see that Capitaland had about two months of consolidation and it finally broke out yesterday. We’re glad we managed to catch this move up and ALERTED our clients of this trade analysis.

Capitaland broke above the 50ema and saw a nice run up to $3.15 closing at $3.14. Our first target of $3.12 was met, a nice upside of over 3% in a day. As the consolidation was for awhile, we’re hoping for the next target to be met. Fingers cross.

Want to be part of this EXCLUSIVE GROUP that were alerted of such a trade analysis?

Wait no more! CONTACT US NOW to see how you can be part of this group to receive value added service sent straight to your handphone.

Yours

Humbly

Kelwin&Roy