Capitaland – [ Landing On Our First Target, More Downside With Results Around the Corner? ]
3rd August, 2020, 6:40 PM

Capitaland – [ Landing On Our First Target, More Downside With Results Around the Corner? ]Capitaland 3rd Aug 2020


Chart Source: Poemsview 3rd Aug 2020

Capitaland together with the other big property counters like UOL and CityDev like we mentioned this morning took a dive today and closed down to near day low.

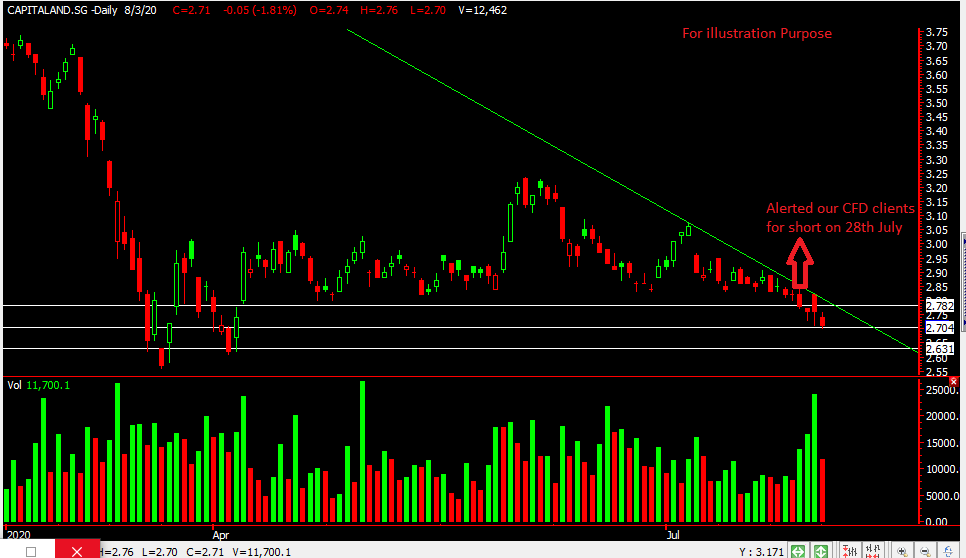
Property counters and bank counters being part of the STI component, were mainly beaten down bringing the STI down today. Capitaland actually broke its horizontal support back last week of $2.80 and did not have enough strength to regain its footing. We saw weakness when it broke its horizontal and hence alerted our CFD clients for short last week.

We’re glad that Capitaland went according to plan and hit our downside target of $2.70 a nice 3% downside in less than a week.  $2.70 might provide some support as its a round number support and also a horizontal support. Failing to hold this we might see our second target of $2.63. Continue watching it!

Want to be part of this EXCLUSIVE GROUP that were alerted of such a trade analysis?

Wait no more! CONTACT US NOW to see how you can be part of this group to receive value added service sent straight to your handphone.

Yours

Humbly

Kelwin&Roy

City Dev – [ A Bearish Trend Developing? ]

3rd August, 2020, 8:03 AM

 City Dev – [ A Bearish Trend Developing? ]City Dev 3rd Aug 2020

Chart Source: Poemsview 3rd Aug 2020

City Dev along with the other big property stocks like capitaland and UOL doesn’t seem to be performing well in the past week. It hasn’t been able to break that downtrend line and is currently resting on the horizontal support line.

With the current Covid situation, property developers might take a hit on all fronts with business slowing down in most sectors. City dev has development in many areas like residential properties, commercial, hotels which could take a hard hit during this Covid period.

If City dev breaks that horizontal support then we might see it move down to the next good support at around $7.65. The resistance would be at the downtrend line and a break above that might signal a good rebound.

Lets watch! We’re looking at more weakness first.

Want to know more about City Dev? Drop us a message!

Yours

Humbly

Kelwin&roy


Wilmar – Updates On China’s Listing, Price Started To Move Up, Next Resistance?

28th July, 2020, 6:53 PM

Wilmar – Updates On China’s Listing, Price Started To Move Up, Next Resistance?Wilmar 28th July 2020

Chart Source: :poemsview 28th july 2020

Wilmar continued its move up today partly because of some updates released regarding its China’s IPO. More about the updates can be read HERE. From our previous post, we mentioned that Wilmar might see a move up to $4.46 which is our second target. We’re glad it hit it which gave us a nice 5% upside in less than a month.

The volume traded for Wilmar is higher than the last few weeks and if Wilmar manages to stay above $4.46 we might see it move higher in the coming weeks. We’re looking at around $4.59 in which you’ll have to zoom out of the chart in order to see it. If Wilmar break below that uptrend line our upside target might not hold.

Stay alert and let’s watch!

Want to be part of this EXCLUSIVE GROUP that were alerted of such a trade analysis?

Wait no more! CONTACT US NOW to see how you can be part of this group to receive value added service sent straight to your handphone.

Yours

Humbly

Kelwin&Roy

Wilmar – Coming Close To Jan’s High, IPO Hype, What’s The Plan Now?

16th July, 2020, 7:53 AM

Wilmar – Coming Close To Jan’s High, IPO Hype, What’s The Plan Now?Wilmar 16th july 2020

Chart source: Poemsview 16th July 2020

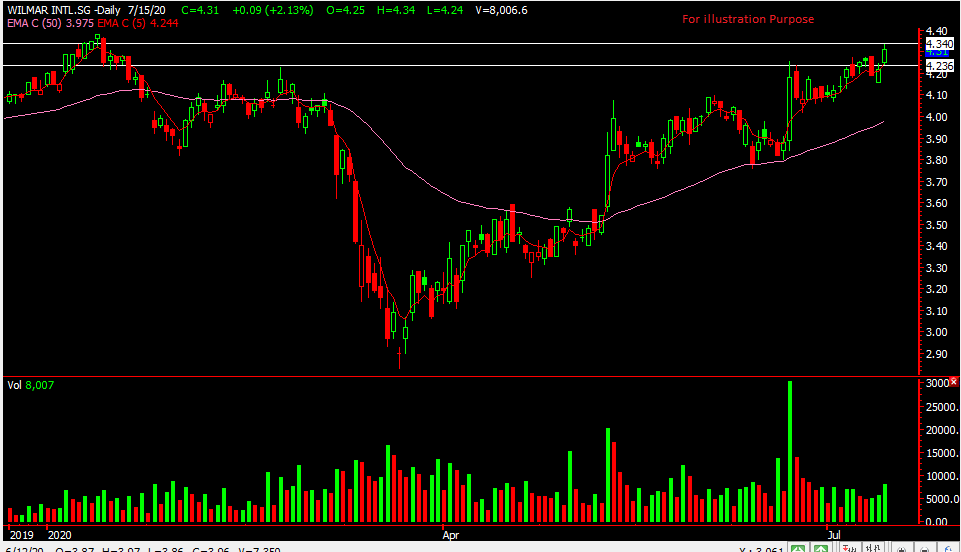
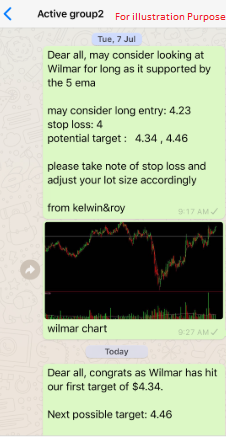
Wilmar part of the STI component stock saw a nice push up yesterday in the late afternoon. It closed up 2.1% which also nicely met our first upside target of $4.34. It was just a week back when we saw Wilmar being supported by the 5ema which we then alerted our EXCLUSIVE CLIENTS.

The listing of ts subsidiary could be one factor for this upside and another could be the general positive sentiment through the overall market.  More of Wilmar’s China IPO can be read here.

It also saw an increase in volume today too which might support the price to the next upside $4.38 and might even push it higher to our second target of $4.46.

Stay alert and let’s watch!

Want to be part of this EXCLUSIVE GROUP that were alerted of such a trade analysis?

Wait no more! CONTACT US NOW to see how you can be part of this group to receive value added service sent straight to your handphone.

Yours

Humbly

Kelwin&Roy

St Engineering – [ Watching For The Next Break! ]

8th June, 2020, 7:25 AM

St Engineering – [ Watching For The Next Break! ]st engineering 8th June 2020

Chart Source: Poemsview 8th June 2020

St Engineering is no stranger to most Singaporeans as it is also one of the STI component stock. It was hit badly at the start of the Covid panic and has since seen some recovery.

Investors/ traders were initially afraid of its aerospace arm which could take a bit hit due to the cut in air travel. Nonetheless, ST Engineering still a good defensive play as it many other components like the Smart City.

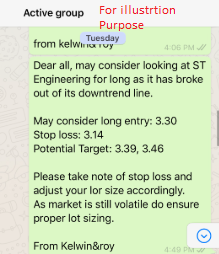
We alerted our clients just last Tuesday ( 2nd June) when ST engineering was trading at $3.30 when it broke its downtrend line . We’re glad that it managed to recover 7% hitting our third target of $3.54. It had a good closing and we’re watching to see if it can break $3.54 which might take us to our next target of around $3.64.

Stay alert and let’s watch!

Want to be part of this EXCLUSIVE GROUP that were alerted of such a trade analysis?

Wait no more! CONTACT US NOW to see how you can be part of this group to receive value added service sent straight to your handphone.

Yours

Humbly

Kelwin&Roy
 

Capitaland – [ Landed On Our First Target, Next Target? ]

2nd June, 2020, 6:55 PM

Capitaland – [ Landed On Our First Target, Next Target? ]

Capitaland 2nd June 2020

Chart Source: Poemsview 2nd June 2020

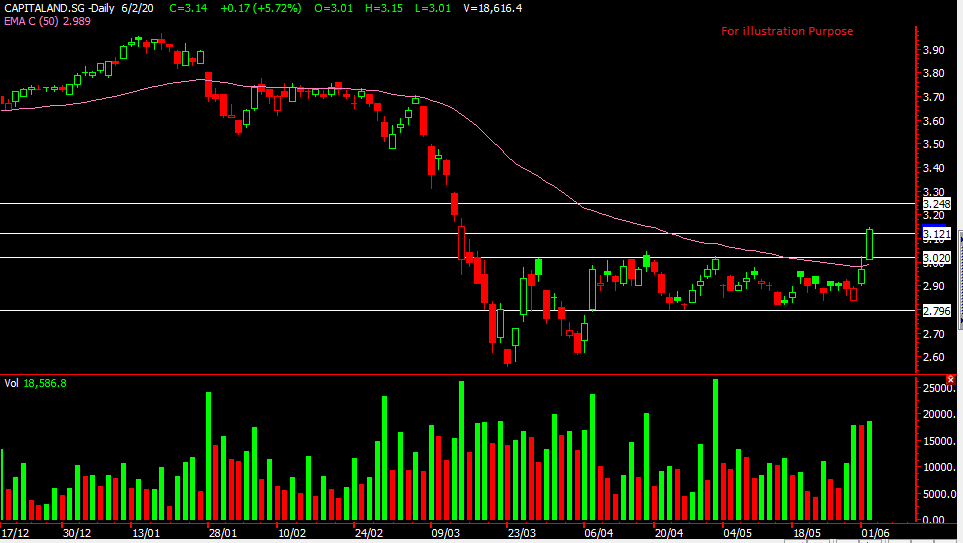
Capitaland came in the top 3 in terms of percentage gain.  It trailed slightly behind SATS and SIA which both also had a good showing and finished up 5.72%. Market was strong overall partly due to the end of circuit breaker and gradually opening up the economy.

From the chart we can see that Capitaland had about two months of consolidation and it finally broke out yesterday. We’re glad we managed to catch this move up and ALERTED our clients of this trade analysis.

Capitaland broke above the 50ema and saw a nice run up to $3.15 closing at $3.14. Our first target of $3.12 was met, a nice upside of over 3% in a day. As the consolidation was for awhile, we’re hoping for the next target to be met. Fingers cross.

Want to be part of this EXCLUSIVE GROUP that were alerted of such a trade analysis?

Wait no more! CONTACT US NOW to see how you can be part of this group to receive value added service sent straight to your handphone.

Yours

Humbly

Kelwin&Roy
Sembcorp Industries – [ Continue To Slide Down As Per Blog, Some Learning Points]

29th May, 2020, 7:09 PM

Sembcorp Industries – [ Continue To Slide Down As Per Blog, Some Learning Points] Sembcorp Industries 29th May 2020

Chart Source: Poemsview 29th May 2020

Sembcorp Industries lost its footing and fell close to 10% today. It was the second top loser in percentage for the STI component stock . Part of this fall might be attributed to the removal of Sembcorp Industries from the MSCI Singapore Index. Other stocks like SPH, Comfort and SATS also saw a fall for today.

Let’s re-look and see if we can learn anything from this. As from the blog, we posted in the MORNING when Sembcorp Industries was trading at around 1.46 and gave a warning sign that it might continue to fall. As it was consolidating for a few weeks, a breakout or breakdown might set the tone for the stock in the coming days. True enough Sembcorp Industries broke down and headed south .  Another explanation could be investors/traders buying near the support might cut loss as it broke their support, this also might invite shortist to come in to short as has broke down .

Hope our readers have learnt a thing or two from our trading blog.  We look forward to sharing more with you.

Interested in being our client to receive value added services?

Drop us a line and you’ll get back to you soonest.

Yours

Humbly

Kelwin&Roy


Sembcorp Industries – [ Breaking Support? How Does The Chart Look? ]

29th May, 2020, 11:24 AM

Sembcorp Industries – [ Breaking Support? How Does The Chart Look? ]Sembcorp Industries 29th May 2020

Chart Source: Poemsview 29th May 2020

Sembcorp Industries a STI component stock has largely seen a sideways consolidation since March. The range it was trading is around $1.47-$1.64.

What caught our attention is that Sembcorp industries seems to have broke its horizontal support of $1.47. If  it doesn’t regain this footing, we might see it move lower in the coming days and weeks. The downtrend line acts as a resistance and until it manages to break above that, Sembcorp Industries might continue to be weak.

It’s already at its 10 years low, so how low can it go?? What’s your trade plan like? $1.40 might be on the cards if it does stay below $1.47 in the coming days.

Yours

Humbly

Kelwin&Roy


City Dev – [ Developing A Bearish Trend? ]

24th May, 2020, 7:27 PM

City Dev – [ Developing A Bearish Trend? ] City Dev 24th May 2020

Chart Source: Poemsview 24th May 2020

City Dev part of the STI component and a leading global real estate property developer. It saw some heavy selling last friday due to the unrest in Hong kong.

Now is City Dev in bearish terrority? From the technical charts we can see that it is below the 200ema. A stock that is below this long term indicator is considered bearish from a chartist point of view. With that and also breaking the short term uptrend line we drew we ALERTED our CFD Clients on a potential short.

CFD Clients were alerted on 13 May when City Dev broke the uptrend line and also below its 20ema. City dev continue to slide down to our first target of $7.56 and is now just 2 cents to our second target of $7.36. City dev was trading at $7.37 at close.

The volume traded last friday was rather high and this might signal more downside if it breaks the horizontal support of 7.34. The next downside target might be 7.03!

Want to be part of this EXCLUSIVE GROUP that were alerted of such a trade analysis?

Wait no more! CONTACT US NOW to see how you can be part of this group to receive value added service sent straight to your handphone.

Yours

Humbly

Kelwin&Roy

DBS – [ Rebound or Down? ]

23rd April, 2020, 7:07 PM

DBS – [ Rebound or Down? ] DBS 23rd April 2020

Chart Source: Poemsview 23rd April 2020

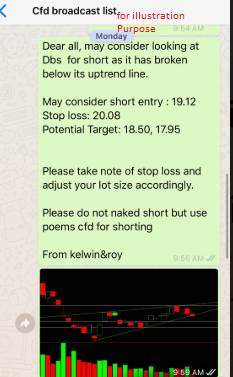
DBS has been seeing selling in its shares for the past week. It broke down from our uptrend line and also the 5ema which gave us some conviction to alert our CFD clients on this potential analysis.  To add further pressure to the already stressed up system, news came out regarding Hin Leong Trading.  Many banks were involved in this high profile cases now.

As DBS broke its uptrend line of 19.12, the downward pressure came in and took it down to our first target of $18.50. We saw a slight rebound and a test of the 5ema but DBS failed to gain footing above it.

If DBS can’t close above this in the next few days we might see more downside. Which camp will you be on?

Want to be part of this EXCLUSIVE GROUP that were alerted of such a trade analysis?

Wait no more! CONTACT US NOW to see how you can be part of this group to receive value added service sent straight to your handphone.

Yours

Humbly

Kelwin&Roy