Sembcorp Industries – [ $1.55 Target Hit! Next Target?? ]

27th October, 2020, 5:57 PM

Sembcorp Industries – [ $1.55 Target Hit! Next Target?? ]Sembcorp Industries 27th Oct 2020

Chart Source: Poemsview 27th Oct 2020

Sembcorp Industries gave us a pleasant surprise and moved up over 4.5% to hit our target of $1.55 just a day after we posted. Once again it bucked the overall trend and emerged top for the STI component.

So now that $1.55 has been hit, what’s our next target? We’re looking at $1.60 then $1.64 but of course not overnight unless Sembcorp Industries decides to surprise us! It’s good to learn how to swing your trade using CFD and not overtrade by going in and out. Learning to have a trailing stop is also important in order to ride your trade. The 10ema would be our support for now.

One suggestion might be the breakout point of $1.46 as ur trailing stop or maybe even $1.50 if u want to protect more of your profit. Remember to always take some profits off the table so you can utilize your funds too.

Want to cut through the noise and get such trade alerts straight to your handphone?

Then be our EXCLUSIVE CLIENT and find out how much value is waiting for you!

See you onboard soon!

Yours

Humbly

Kelwin&Roy


Sembcorp Industries – [ Broke Above $1.46 Resistance, Is $1.55 Possible? ]

26th October, 2020, 7:12 PM

Sembcorp Industries – [ Broke Above $1.46 Resistance, Is $1.55 Possible? ]Sembcorp Industries 26th Oct 2020

Chart Source: Poemsview 26th Oct 2020

Sembcorp Industries once again bucked the overall downtrend today and emerged positive closing up 2%. It’s one of the rare few stocks in the STI component that managed to remain positive and hopefully we’ll see more upside.

It took a nice break consolidating for the past few and breaking out of the $1.46 horizontal resistance despite a down day. This shows strength to us furthermore, there is an increase in volume too. From our previous post, Sembcorp Industries has hit our $1.47 target and we might see $1.52 next. $1.55 might even be possible before it starts taking a break. A sustain in volume is something we’re looking out for in order for this uptrend to continue. We’ll prefer to use poems CFD in order to ride such trades as compared to contra.

Don’t forget election is just about a week plus away!

Want to cut through the noise and get such trade alerts straight to your handphone?

Then be our EXCLUSIVE CLIENT and find out how much value is waiting for you!

See you onboard soon!

Yours

Humbly

Kelwin&Roy
 

SATS – [ Skies Are Opening Up! But Not Clear Skies Yet ]

21st October, 2020, 6:45 AM

SATS – [ Skies Are Opening Up! But Not Clear Skies Yet ]

Chart Source: Poemsview 21st Oct 2020

SATS has caught our attention since early Aug when covid cases started to stabilize and when it was trading at around $2.84. Talks were in place for travel to restart too. Singapore has been doing keep covid cases at bay with an average of 1-2 cases in the community which is  giving travelers some confidence. Phase 3 could be on the cards by year end too!

More good news as Singapore is firming up talks on travel to HK while SIA is also opening up its non-stop flight to NYC. More flights are opening up to Australia too. Cruise to nowhere is also starting next month and all these restarts are good for the badly beaten SATS. Yes, travel demand is not going through the roof yet, but countries are taking the right steps in trying to open their tourism industry.

From a technical perspective, Sats is currently above the 100ema which it hasn’t cross in awhile so this is a positive sign to us. It recently tested this support which is also the downtrend line which we drew which showed strength and could bounce back up. Immediate resistance we see is at $3.14-3.15 once that is cleared we might even it challenge the 200ema in the coming weeks.

Keeping a close watch on SATS

Yours

Humbly

Kelwin&Roy

Sembcorp Industries – [ Bucking The Overall Trend Today, More Possible Upside? ]

15th October, 2020, 5:26 PM

Sembcorp Industries – [ Bucking The Overall Trend Today, More Possible Upside? ]


Chart Source: Poemsview 15th Oct 2020

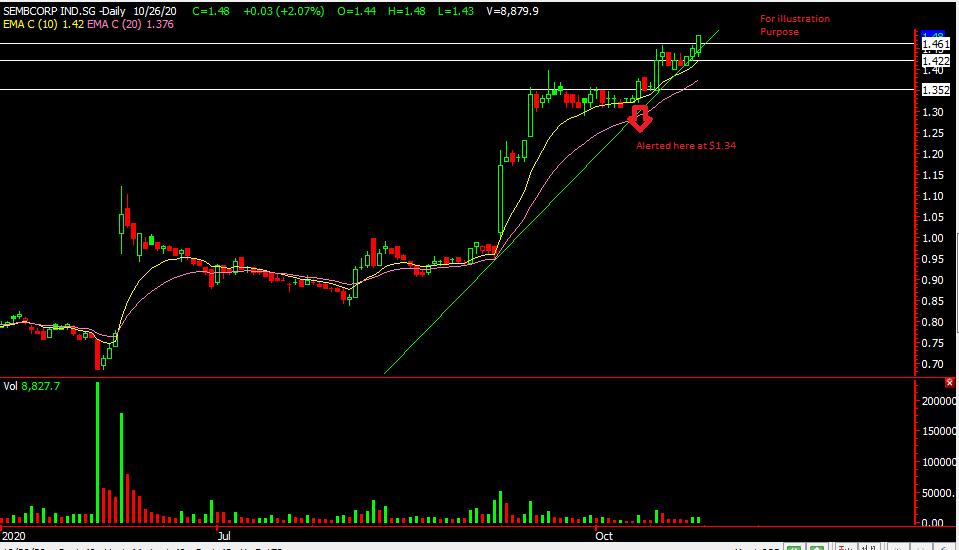
Sembcorp Industries one of the rare few counter that buck the downtrend and closed positive. In fact, it’s the highest percentage gain within the STI component for today.

We’re glad we managed to catch Sembcorp Industries just before it broke out alerting our EXCLUSIVE CLIENTS on Monday when it was trading at $1.34. A nice 10 cents upside which is about 7.5% in a week is a good trade to us! Could Sembcorp Industries continue its run? We think it might be possible given that its strong in a weak market, there is volume coming in and it closed above the $1.40 horizontal resistance.

Our next possible upside is $1.47. But do be cautious, elections is in about 3 weeks, so things could start to get volatile again.

Want to cut through the noise and get such trade alerts straight to your handphone?

Then be our EXCLUSIVE CLIENT and find out how much value is waiting for you!

See you onboard soon!

Yours

Humbly

Kelwin&Roy

Ascendas Reit – [ What Has It Broken Out From? ]

13th October, 2020, 5:10 PM

Ascendas Reit – [ What Has It Broken Out From? ]

Ascendas Reit 13th Oct 2020

Chart Source: Poemsview 13th Oct 2020

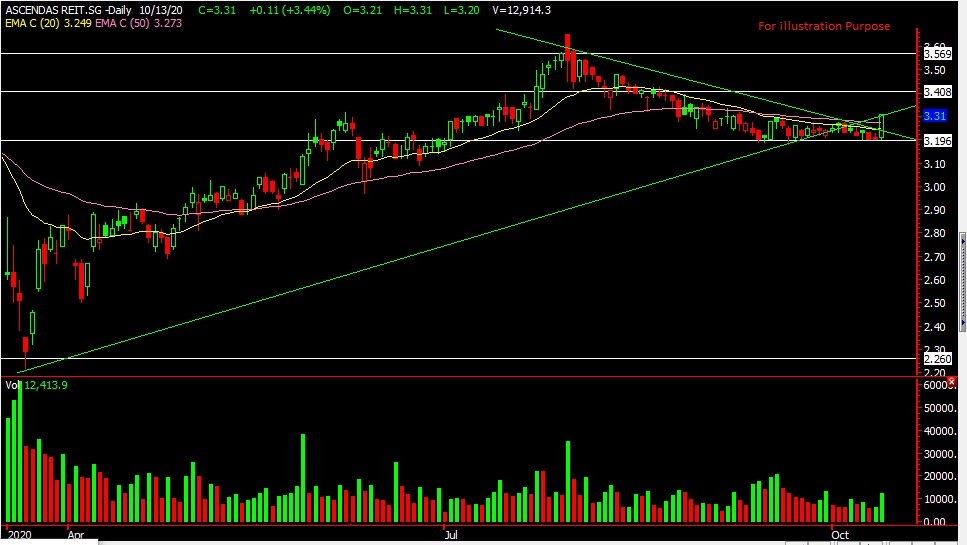
Ascendas Reit is a business space and industrial reit which i’m sure many would have seen their spaces all over Singapore. It is also part of the STI component. The Singapore portfolio includes Business and Science parks, High specs industrial & Data Centres. In 2019  ,Ascendas REIT acquired 28 business park properties in three growing US tech-cities. High-specs industrial and data centres make up 17% of its portfolio; with ICT customers contributing 9%, and data centres contributing 5%, to its monthly gross revenue. Data centres like we mentioned in our previous post of Keppel DC Reit is a hot asset in the market. Though Asecndas Reit is not a direct play its good to have a mix of it.

It’s dividend yield is around 4.9% which is decent. So let’s look at it from a technical analysis perspective.

It has broken above its 20 and 50ema which is a positive sign. If you look back, these two moving averages as been acting as the resistance and finally today it managed to break above it. Volume came in too as we can see it’s higher than the last few days. These are positive signs to us.

We have drawn some of the support and resistance level and we might see $3.40 in the coming weeks.

Keep a close watch!

Yours

Humbly

Kelwin&Roy


Capitaland – [ Rebounding Off The Bottom, How Far More Can It Go? ]

6th October, 2020, 3:45 PM

Capitaland – [ Rebounding Off The Bottom, How Far More Can It Go? ]Capitaland 6th oct 2020


Chart Source: Poemsview 6th Oct 2020

Capitaland part of the STI component stock had a nice rebound ever since we mentioned about its base building just last week. It has reached our target of $2.80 in less than a week and experienced some pullback after hitting the resistance. Property counters are generally lagging behind but with strong sales, could these counters start to pick up?

Using technical analysis, for now 2.80 shall be the resistance and if Capitaland can break that we might see it move higher to around $2.86-2.88 which is the 100ema and the horizontal resistance.

Don’t forget to follow us on Investingnote as we do post there frequently too.

Yours

Humbly

Kelwin&roy

Capitaland – [Base Forming? Bottoming? ]

1st October, 2020, 1:34 PM

Capitaland – [Base Forming? Bottoming? ]Capitaland 1st oct 2020

Chart Source: Poemsview 1st Oct 2020

Capitaland seems to have bottomed with a base forming around $2.65 level. The next level of support might be at $2.60. Property counters have been lagging and strong property sales figure have been seen in the last few months. Could property counters start their move up? And could it help to push the STI up as its part of the STI component?

Head over to our post on investing notes to know more. Watching Capitaland with interest.

Yours

Humbly

Kelwin&Roy

SATS – [ Let’s Review This Set Up Just Two Weeks Back]

25th August, 2020, 5:51 PM

SATS – [ Let’s Review This Set Up Just Two Weeks Back] SATS 25th aug 2020

Chart source: Poemsview 25th Aug 2020

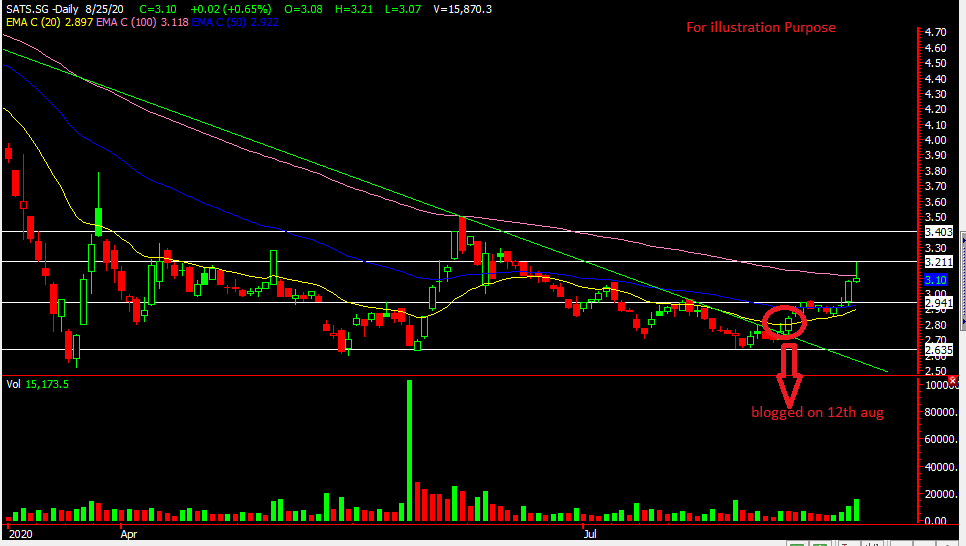
SATS had some upside despite its net loss of $43.7m in 1Q20/21. This loss could be widely anticipated and it was in line with what analyst predicted. What was interesting again was that despite the negative news, SATS still climbed up yesterday.

It challenged the 50ema this morning, broke it and went to the next resistance. It has a nice upside of over 10%  since we spotted this 2 weeks back at $2.84

For now, analyst are mixed over SATS and most are anticipating some recovery with opening of some borders.

If you want to know how to swing your trade without having to go in and out. You may consider using Phillip CFD as one will not be pressured by time to sell off your position.

We use CFD in our trades to help us to swing our trade in order to ride the trend.


SATS – [ Moving Up From Yesterday’s Blog]

13th August, 2020, 7:00 PM

SATS – [ Moving Up From Yesterday’s Blog] SATS 13th Aug 2020

Chart Source: Poemsview 13th Aug 2020

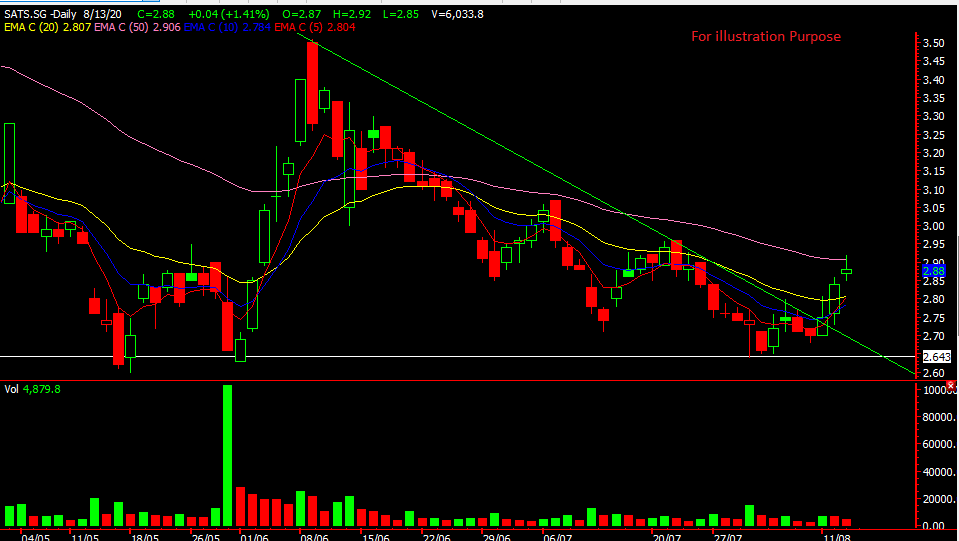
SATS continued its movement seeing close to a 3% upside move from yesterday’s close. This is higher than the movement of the STI. It reached the 50ema of around $2.90 which was a resistance we mentioned just yesterday! SATS couldn’t break above it which we kind of expected as this could be a strong resistance.

If it can consolidate around this range then it might be ready to take on the next level at $3.01.

We hope you learnt something from our sharing yesterday! 

Want such analysis sent to your phone via whatsapp?

Just drop us a message and you’ll let you know how.

Yours

Humbly

Kelwin&Roy

SATS – [ Spot Anything Interesting In The Chart? ]

12th August, 2020, 7:05 PM

SATS – [ Spot Anything Interesting In The Chart? ] SATS 12th Aug 2020

Chart Source: Poemsview 12th Aug 2020

Let’s take a look at SATS, part of the STI component stock. It has once again caught our attention as it has form a small base and started to climb up. The hospitality  and aviation sector as we all know it is the weakest of all sector currently. So these plays are more suited for a rebound until a credible vaccine is found.

It tried to cross that downtrend line yesterday but failed to do so. Today it tried once again and it managed to cross and stay above the downtrend line. SATS also managed to stay above its 20ema another interesting point to take note.

The next resistance might be at the 50ema at around $2.90 first. From the chart we can see that the 50ema acts as a strong resistance and if SATS can break above this we might see some good upside.

Let’s keep watching it.

Yours

Humbly

Kelwin&roy