Straits Times Index – [ Upside Coming? Levels We’re Looking At]

13th October, 2019, 9:45 PM

Straits Times Index – [ Upside Coming? Levels We’re Looking At]Straits Times Index 13th Oct 2019

Chart Source: Poemsview 13th oct 2019

Straits Times Index have been resisted by the downtrend line which we drew recently. Some key points we are looking at.

  1. STI breaking above the downtrend line
  2. STI breaking above the 20ema
  3. Good trade talks results which might help fuel the break up

With those points we’re hoping for a positive run up to the next resistance to the 50ema. The ride might not be a smooth one up as who knows what Donald Trump might tweet next.

Want to know more on you can be trading the Straits Times Index? We hope that our trading blog has given some insights into the market.

Just drop us a message and we’ll be glad to guide you through it.

Yours

Humbly

Kelwin&Roy

Straits Times Index – [ 4 Down Days Wiping Out Almost 2 Months Of Gains, What Can A Trader Do?]

5th August, 2019, 9:35 PM

Straits Times Index – [ 4 Down Days Wiping Out Almost 2 Months Of Gains, What Can A Trader Do?]Straits Times Index 5th Aug 2019

Chart Source: Poemsview 5th Aug 2019

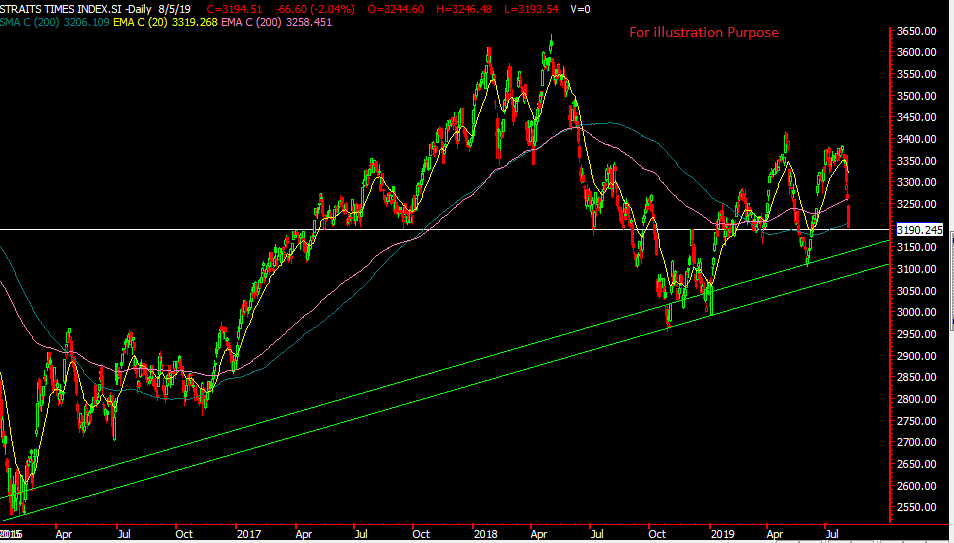
Straits Times Index took a huge plunge of about 5% since it started to fall on Wednesday. In 4 days of fall it nearly took out 2 months of gain in the STI. When panic spreads, it goes beyond any rationale. If a trader only knows how to go long in the market then he or she would be in big trouble.

That is why we’ll be conducting a workshop on 20th Aug (Tuesday) to coach and guide why using CFDs is vital in staying afloat in today’s market.

Knowing only how to Long and not SHORT would put a trader in a severe disadvantage as he or she can only trade in one direction. Hence it is of utmost importance to equip oneself with the knowledge and tool for shorting to hedge and manage market volatility .

Not only does Poems CFDs allow you to long or short the market it also allows you to trade our Straits Times Index. In fact, Poems CFD is the only CFD provider in singapore to provide the STI. So if you’re unsure of which stock to trade, there is always the Straits Times Index to trade.

Sign up via the link now!

https://www.eventbrite.sg/e/trade-war-interest-rate-cut-how-to-use-cfd-moving-average-to-manage-current-volatile-market-tickets-67919419813

We’ll see you there!

Yours

Humbly

Kelwin&Roy

Straits Times Index – [ Rebound Rebound Rebound! Updates Updates!]

1st July, 2019, 9:09 PM

Straits Times Index – [ Rebound Rebound Rebound! Updates Updates!]

Chart Source: Poemsview 1st July 2019

Straits Times index or STI along with regional markets saw a nice upside after the G20 meeting. A positive outcome where US and China are ‘back on track‘ with no further trade tariffs in the near term as leaders will resume trade talks.

As for our STI, ever since we alerted our readers of the potential rebound on 5th June, STI has made a V shape recovery which is rather impressive in our humble opinion. STI is up close to 7% which in less than on month which is very good according to us. Many blue chips counter like Wilmar, Capitaland, UOL, our three local banks have seen a nice rebound.

If we take  a look at the chart now we can see that STI is nearing its resistance but if the bullish sentiments continues we might see it breakout of that and retest the previous high of 3400 area. We’re using the 5ema for now as a guide for the support as that has been supporting the index for the last few weeks.

Lets keep watch. Fed meeting is at the end of the month, could the market run ahead of it with a possibility of a rate cut?

Do CONTACT US if you want to know more.

Yours

Humbly

Kelwin&Roy

Straits Times Index – [ Rebound As Per Blog, Our Next Move? ]

11th June, 2019, 9:38 PM

Straits Times Index – [ Rebound As Per Blog, Our Next Move? ] Straits Times Index 11th June 2019

Chart Source: Poemsview 11th June 2019

Straits Times Index saw a nice rebound over the week up over 80 points since we mentioned last Wednesday .

It has hit our first rebound target of the 200sma as mentioned in our previous post

What’s our next resistance? We’re putting it at the 200ema which is around 3227. Hitting there might see some resistance and abit of consolidation might take place. A good pullback might present an opportunity to scale into the market.

Most blue chips counters like Capitaland, UOL, CityDev have seen a nice run up on expectation of rate cuts which could benefit property stocks as their cost of borrowing goes down. Bank stocks hasn’t ran as much but nonetheless shown some good rebound.

Oil stocks has also staged some rebound and hoping for some nice upswing.

We’ll be conducting a workshop very soon on the lessons learnt from this trade war and how to use one simple indicator to help improve your analysis.

Keep a lookout for it.

Yours

Humbly

Kelwin&Roy

Straits Times Index – [ Our Take On It And Our Game Plan]

5th June, 2019, 9:23 PM

Straits Times Index – [ Our Take On It And Our Game Plan]

Straits Times Index 5th June 2019

Chart Source: Poemsview 5th June 2019

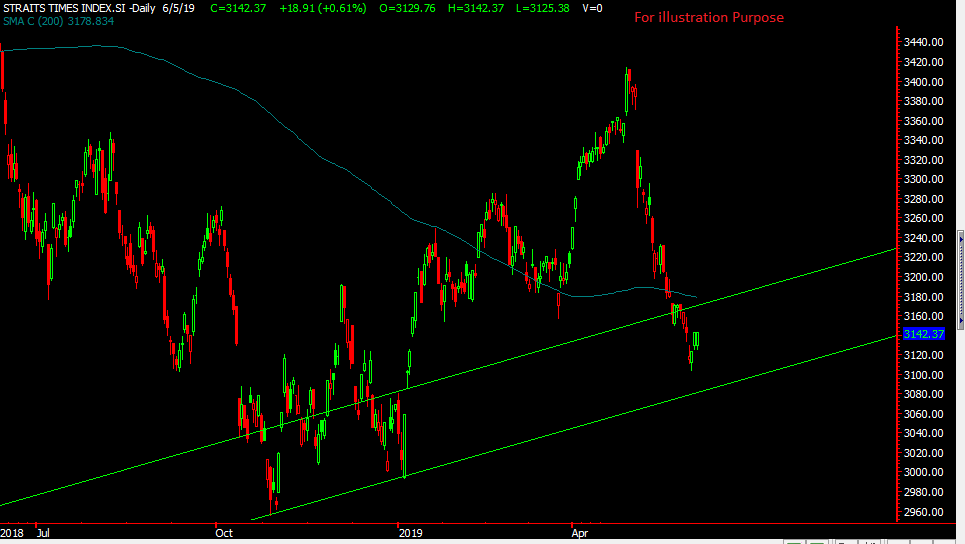
Straits  Times Index had a terrible May and fulfilled the saying of Sell and Go Away in May. Our index has fallen 8.5% since the start of May but things might start looking up.

We have drawn two charts with the first stretching out from 10 years and drawing a long term uptrend line. So far that point hasn’t been tested which is around 3080 area.

Something to take note is that the bounce from 2016 and the bounce off that long term uptrend line in 2018 seems shorter now. Every bounce is shorter which to us is not a good sign. What might happen is that is uptrend line might be tested and a rebound might happen but we’ll be watching to see the strength of the rebound.

On a shorter time frame, the immediate support is around 3100 which is the short term uptrend line which we have drawn. We would like it to test that area and then rebound which would then complete this downward cycle and allow for a nicer rebound. With Dow having such a strong finish on tuesday night good chance we might see our Straits Times Index doing some catch up.

A good bounce to the 200ma might be the next resistance before we plan our next move. Should more good news follow like trade wars being resolved or more talks that could provide some underlying strength to the market. Or the recent rate cut which the fed seems to be signalling to the market. Most stocks have seen a brutal sell down and might be ready for a rebound.

So do be prepared as we markets remain volatile. So Sit Tight and tread carefully.

Do CONTACT US if you want to know more.

Yours

Humbly

Kelwin&Roy

Straits Times Index- [ Hit Our Final Resistance, What We’re Looking At Now]

3rd December, 2018, 8:24 AM

Straits Times Index- [ Hit Our Final Resistance, What We’re Looking At Now]Straits Times Index 3rd Dec 2018

Chart Source : Poemsview 3rd Dec 2018

Straits Times Index has hit our downtrend line which we projected for this round of rebound back in November. It has been lowered as the duration of rebound was longer than expected hence the target has been shifted down to 3130.

What are we looking for next? With discussion from the G20 summit about Trump holding off on raising China tariffs to 25% for 90 days, this might propel our Straits Times Index to break that downtrend line resistance.

One good point is that STI is currently holding above the 50ema. We might see an upside target of 3163 then 3189 if the that downtrend line is broken.

Let’s hope for positive and constructive discussion for the G20.

What’s your trade plan like?

Don’t wait and CLICK HERE to see how you can join this community and all the exciting perks of being a Client of Kelwin&Roy

Yours

Humbly

Kelwin&Roy

Straits Times Index – [ Rebound Came As Posted, Up 100+ Points, What Are We Looking At Now? ]

4th November, 2018, 9:14 AM

Straits Times Index – [ Rebound Came As Posted, Up 100+ Points, What Are We Looking At Now? ] Straits Times Index 4th Nov 2018

Chart Source: Poemsview 4th Nov 2018

Straits Times Index had a magnificent run once again with a rebound of over 100 points since our post on it last Monday Night.

While many were still bearish and  looking to short from our post we were looking out for a rebound.

STI ran up over 100 points or close to 4% in three days causing most shortist to cover their position. Such an increase might have taken traders by surprised but we were prepared for such a run.

Blue Chips like Banks and Property Stocks led the Charge as mentioned in the same Blog Post too. We hope that our avid readers have learnt something from this and maybe even benefitted from this rebound!

So what are we seeing in STI next?

  1. We have drawn the downtrend resistance line which is around 3160 and might  be our target for this rebound for now
  2. Currently, STI almost covered the Gap resistance and is also around the 50ema resistance which is 3130 area.
  3. A pull back wouldn’t be too much to expect and a pull back might present some opportunity for short term trading.

Last week for a good week for bullish traders and we hope it was good for you too. Our list of stocks all performed well. How about yours?

We’ll be conducting a final workshop on how to use CFD to long or SHORT the STI index in Nov before the year comes to a close.

Look out for it!

Still clueless on the market direction? Not sure of which stock to look out for during a rebound?

Want to be part of this EXCLUSIVE COMMUNITY help guide and prepare for market.

Don’t wait and CLICK HERE to see how you can join this community and all the exciting perks of being a Client of Kelwin&Roy

Yours

Humbly

Kelwin&Roy
Straits Times Index – [ Rebound In Sight After The Panic Selling? What Is The Chart Saying? ]

29th October, 2018, 8:41 PM

Straits Times Index – [ Rebound In Sight After The Panic Selling? What Is The Chart Saying? ]Straits Times Index 29th Oct 2018

Chart Source: Poemsview 29th Oct 2018

Straits Times Index fell to our planned area of 2985 from our previous post and fell further to around 2960. We’re glad that the Straits Times Index moved as planned and currently is sitting on the long term support line as drawn.

Will This support hold? Who knows right? But we’re seeing some signs of resilience and the 2960 levels seems to be holding. On Further examining, the Straits Times Index is currently being pinned down by the 5ema at around 3004. Until this can be broken then we might see some rebound in the near future.

Some points which we might see a rebound to might be 3031 and 3070 if the market continues to hold.

What are some of the stocks on your shopping list? If the market were to rebound are you prepared for it?

We have our shopping list ready! Banks, property counters are at a low, could there be good for a rebound?

Let’s watch!

Still clueless on the market direction? Not sure of which stock to look out for during a rebound?

Want to be part of this EXCLUSIVE COMMUNITY help guide and prepare for market.

Don’t wait and CLICK HERE to see how you can join this community and all the exciting perks of being a Client of Kelwin&Roy

Yours

Humbly

Kelwin&Roy

Straits Times Index – [ Panic All Around But Some Signs Were There When We Posted Back In Sept]

11th October, 2018, 10:26 PM

Straits Times Index – [ Panic All Around But Some Signs Were There When We Posted Back In Sept] Straits Times Index 12th Oct 2018

Chart source: Poemsview 12th Oct 2018

It was a crazy day yesterday where most traders might rather erase it from their memories as our Straits Times Index plunged 84 points or down 2.69%. Such days don’t occur  so often and whenever it does it does cause panic and fear unless you’re on the right side.

How to avoid such pitfalls? Looking at the support/resistance could be one way. Another way is to have an extra pair of eyes during market hours to help bounce off ideas and remind one another of potential dangers. Two Heads are better than one!

From our previous update of the Straits Times Index just end sept, we mentioned that a key resistance was around the 3260 area and true enough the market could not push through and started retracing. From then we were also actively looking out for stocks that were weak as they might be the first to be sold down  True enough they started peeling off one by one. And we’re glad that our EXCLUSIVE CLIENTS were warned out it.  Blue chips started to come off after the rebound, followed by mid cap which we were glad we caught them on the downside and was spared the meltdown yesterday.

We have drawn some possible support levels for the Straits Times Index. Some possible scenarios might be an attempt to rebound to the gap area and failure to clear might see more downside to our lower support of 2985 area. Or it could continue to slide with mini rebounds in between.

Will update more when the time comes.

Meanwhile Happy trading!

and If you need an extra pair of eyes during market hours you know who to Contact! 

We’re right here waiting!

Yours

Humbly

Kelwin&Roy


Straits Times Index – [ Where To Now?]

25th September, 2018, 8:36 AM

Straits Times Index – [ Where To Now?] Straits TImes Index 25th Sept 2018

Chart Source: Poemsview 25th Sept 2018

Straits Times Index seems to be resisted by the 50 days moving average yesterday as it hit there and came down.

Our Straits Times index staged a relatively impressive rebound from its double bottom of 3100 to a high of 3232 so a small pullback is not too much to ask for.

As its resisted by the 50ma, a pullback to around 3180 area might be possible which might present an opportunity to scale into the market for a rebound. At this level we’ll evaluate the market again.

A rebound might happen which might take us to around 3260 level. A break above the 50ma might signal more upside. So we’re watching for the break.

In the meantime we’re also having a watchlist of stocks for both rebound and for the downside too.

Do you have a watchlist?

Still clueless about what’s happening in the market?

Drop us a line and we’ll be glad to help.

Yours

Humbly

Kelwin&Roy