SGX – [ Meeting Expectations, How To Swing This Trade]

9th February, 2022, 7:44 PM

SGX – [ Meeting Expectations, How To Swing This Trade]

Chart Source: Advisor XS 9th Feb 2022

The Singapore Exchange or SGX for short reported its results on Monday and most analyst were satisfied with the results. The biggest rerating came from Citi analyst upgrading it from a sell to a buy rating with a price target of $10.50. Some highlight of its results :

For the 1HFY2022 ended Dec 2021, SGX reported earnings of $219 million, down 8% y-o-y; adjusted earnings, which SGX claims is a more accurate reflection of its underlying earnings, was down 2% y-o-y.

Revenues of $522 million were flat y-o-y with higher operating expenses of $262 million, up 6% y-o-y, and operating profit of $260 million, down 7% y-o-y.

With more interest in local SPAC (Special Purpose Acquisition Company) listings , this could also support market velocity and fees moving forward for SGX.

Technical Outlook 

As we spotted SGX just a month back when it started to break above its downtrend line, it started to show resilience despite a negative sentiment around that time. For contra players, they might have taken some profits as SGX has risen in a few days. But in order to maximize the trade, a trade might consider using CFD in order to swing in with minimal cost. As our alert was at $9.50, we have seen SGX swinging to a high of $10.03 up over 5%.

There is some resistance between the range of $10.03 -10.10 and overcoming it might see SGX move up to , momentum and volume is building up for SGX and we might see it move to $10.50 before taking a break.

In order to ride the this trend, a trade has to either trade in or out or purchase the share. To know how to swing such a trade at a fraction of a cost and free up your capital then do join us in our upcoming WEBINAR where we’ll show you how to hold on to your winning trades in order to ride the trend!

Date: 17th feb

Time 8-9pm

Register HERE! 

To be a client to receive such awesome trade alerts CLICK HERE! 

Yours

Humbly

Kelwin & Roy

SGX – [ Where’s Our Next Target After Breaking Out]

20th April, 2021, 7:30 AM

SGX – [ Where’s Our Next Target After Breaking Out]SGX 20th April 2021

Chart Source: Poemsview 20th April 2021

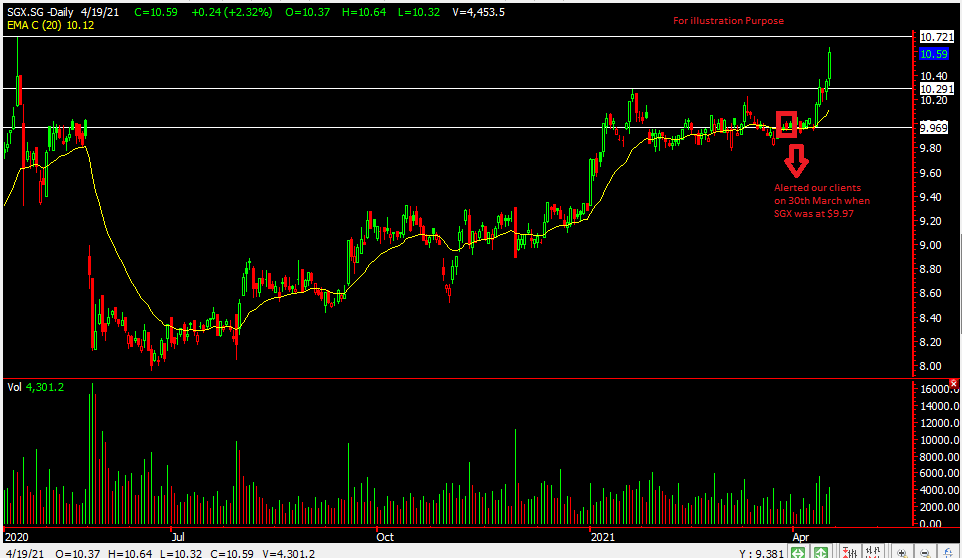
SGX also had a good move yesterday as it broke out once again after it broke the previous high of $10.29.

SGX has also updated last week that the total securities market turnover value on SGX increased 50% month-on-month in March to $38.7 billion, the highest since march 2020. Its derivatives franchise performed strongly q-o-q on the back of broad base volume gains in March across multiple asset classes. Total derivatives traded volume on SGX rose 31% m-o-m in March to 23.2 million contracts, the highest since July 2020. You can read more over HERE.

With that update SGX started to crank up its engine after having consolidated for about 3 months! The breakout that came was strong and sustained as the longer the consolidation or stored energy as some might refer it as the greater the move. Volume also started to build up and that led to SGX having a nice move up.

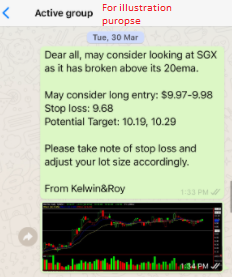
We’re glad we alerted our EXCLUSIVE CLIENTS when we first saw it moving above the 20ema which was a positive sign end March. SGX was trading at $9.97 and have since seen a 6% upside in about 2 weeks.

SGX might move up to challenge its high of $10.72 and probably some profit taking might come in over there. After which if it gain some momentum we might see $10.80 then even $11 in the coming weeks or so.

Don’t want to miss the next trade alert?

Be our EXCLUSIVE CLIENT and receive such trade alert sent straight to your handphone!

Don’t miss out on our next alert! Be a client and find out how to be included in our whatsapp broadcast list.

Yours

Humbly

Kelwin&Roy

SGX – [ Day Low of $8.27, Down 20cents In A Week Since Post]

23rd September, 2019, 5:08 PM

SGX – [ Day Low of $8.27, Down 20cents In A Week Since Post]SGX 23rd Sept 2019

Chart source:Poemsview 23rd July 2019

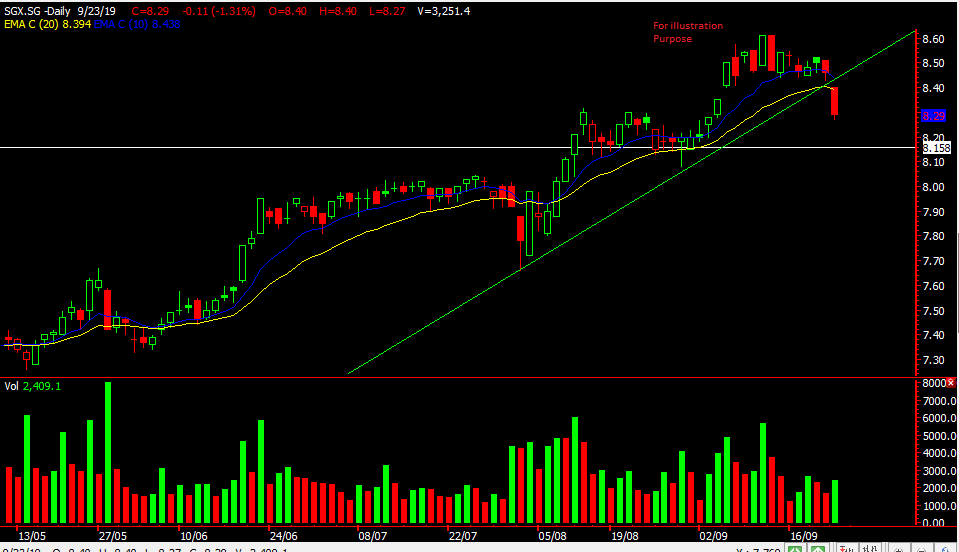
SGX hit a day low of $8.27 down 20 cents since we posted on 18 sept before market open. SGX is down over 2% in less than a week which is a nice gain for us.

We listed the various reason in our previous post for what we saw in SGX that might have led to the downside and will be going through them tonight.

SGX is currently under the 20ema and also under the short term uptrend line. Failing to stay above might see the next downside level to $8.16. Let’s watch it.

See all those who have signed up tonight!

Yours

Humbly

Kelwin&Roy

SGX – [ Getting Tired? Need A Rest? ]

18th September, 2019, 8:08 AM

SGX – [ Getting Tired? Need A Rest? ]

SGX 18th Sept 2019

Chart Source: Poemsview 18th Sept 2019

SGX has seen a nice run up recently but like most stocks after a good run it’s always good to take a break.

The question is, is that break due for SGX? To help us answer that question lets take a look at SGX chart.

From yesterday’s closing, SGX has finally closed below its 5ema which hasn’t happened in awhile. The moving average are converging which might lead to a cross over which might bring some retracement. SGX couldn’t break above its horizontal resistance of 8.61 for the last few sessions.

With that we might see some downside for SGX in the near term. Want to know how to take advantage of the downside?

On 23rd Sept we’ll be conduct a workshop on how to use CFD to short and also reveal one of our trading secrets using the moving averages.

Shorting plays an important role in achieving consistent trading results and not knowing how to do it can seriously handicap a trader.

More details below

Date: 23rd Sept

Time : 7:30-9:30pm

Registration is a must and can be done via the link below

https://www.eventbrite.sg/e/continuation-of-trade-wars-how-to-use-cfd-moving-average-to-manage-current-volatile-market-tickets-72254205273

See you there

Yours

Humbly

Kelwin&Roy


SGX – [ When Will The Selling End? Signs To Look Out For]

14th March, 2019, 8:00 AM

SGX – [ When Will The Selling End? Signs To Look Out For]SGX 14th March 2019

Chart Source: Poemsview 14th March 2019

SGX or Singapore Exchange as some may call it  took  a heavy beating over the past week down 10% since the high of $8.05.

News came out that the Hong Kong stock exchange would start trading derivatives contracts based on Chinese-listed shares pose a new competitive threat to SGX.

Since then SGX gave up 2 months worth of gains in just 5 trading days!

Now is the selling over? Is the selling overdone? Is a rebound in sight? Here are a few things we’re looking out for

  1. For support to hold at$7.20 if not the next level at $7.10 area.
  2. For the volume to start decreasing might mean that selling is slowing down.
  3. For the candlestick to be smaller and not such a long range.
  4. For SGX to regain its hold on the 200ma and even the uptrend line which it has broken down from

Keeping a close eye on SGX for the next few days.

Is SGX on your watchlist?

What’s your trade plan for SGX like?

It is important to have a sound and actionable trade plan in order to be discipline in your trades.

CLICK HERE to see how you can learn how to plan a sound and actionable trade plan and to be part of this EXCLUSIVE COMMUNITY to enjoy such value added services.

Yours

Humbly

Kelwin&Roy

SGX – [ Rebound Came As Blogged From Last Week, Filled The Gap, Next Target? ]

22nd October, 2018, 5:20 PM

SGX – [ Rebound Came As Blogged From Last Week, Filled The Gap, Next Target? ] SGX 22nd Oct 2018

Chart Source: Poemsview 22nd Oct 2018

SGX or Singapore Exchange just released its results for their  first quarter, more can be read HERE.

In addition, analyst have a rating ‘Buy’ for SGX too. Read about it HERE.

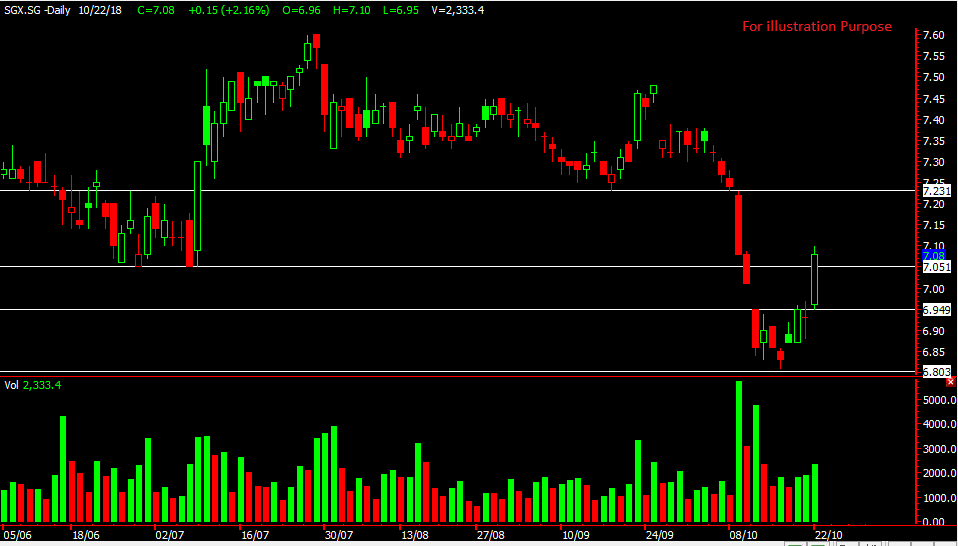
But did you see our blog last week?  We mentioned last thursday that if SGX manages to break above it $6.95 resistance it might cover the gap to reach $7.01 and $7.05 eventually. It reached all our targets and even exceeded it to reach $7.10.

What’s our next target? If SGX manages to close above $7.09 then we might see it attempt to reach $7.23 in the coming days.

SGX closed below $7.09 so lets watch the next few days to see how it performs.

What’s your trade plan like? Having a trade plan is of utmost important!

If you need help with a trade plan you know who to Contact! 

We’re right here waiting!

Yours

Humbly

Kelwin&Roy

SGX – [ Is Singapore Exchange Due For A Rebound?]

18th October, 2018, 3:32 PM

SGX – [ Is Singapore Exchange Due For A Rebound?]SGX 18th Oct 2018

Chart Source: Poemsview 18th Oct 2018

SGX recently announced some market statistics for Sept 2018 which didn’t look too good for the exchange and it started fall. Market volume was generally down which meant that the exchange might have lower revenue. Coupled with the drop in Dow Jones, that made SGX fall quite  a fair bit from $7.25 to $6.81. Read about the market statistics HERE .

Currently SGX seems to be in a consolidation with the support at $6.81 and the resistance at $6.95. A break above $6.95 might see it moving to cover the gap till $7.01 and if market sentiments improve it might take us to $7.05.

A pullback from here to $6.81 might present a chance for entry but if $6.81 breaks and market turn then this trade wouldn’t be valid for us.

What’s your trade plan like?

If you need help with a trade plan you know who to Contact! 

We’re right here waiting!

Yours

Humbly

Kelwin&Roy


SGX – [ $7.21 Downside Target Met, Advanced Warning Given, $7.10 Next? ]

4th June, 2018, 8:12 AM

SGX – [ $7.21 Downside Target Met, Advanced Warning Given, $7.10 Next? ] SGX 4th June 2018

Chart Source: Poemsview 4th June 2018

SGX a blue chip stock and part of the STI component continued to fall last friday hitting our downside of $7.21.

The legal tussle between SGX and the NSE over the Nifty futures is hurting SGX. More can be read HERE. 

Our Exclusive Clients were warned beforehand before the drop when SGX was trading at $7.39. A nice 2% downside was seen within the week.

In fact this was the second stock that was covered and sent to our exclusive client over the week for them to plan their trade before the market opens.

This is just one of the many benefits of being our client. So much more awaits you.

Want to be part of this exclusive group to receive such trading analysis?

Be a client of Kelwin&Roy in order to benefit from their wide range of value added services and to be part of their exclusive community.

Yours

Humbly

Kelwin&Roy


SGX

12th September, 2016, 3:18 PM
SGX July 2016
SGX July 2016

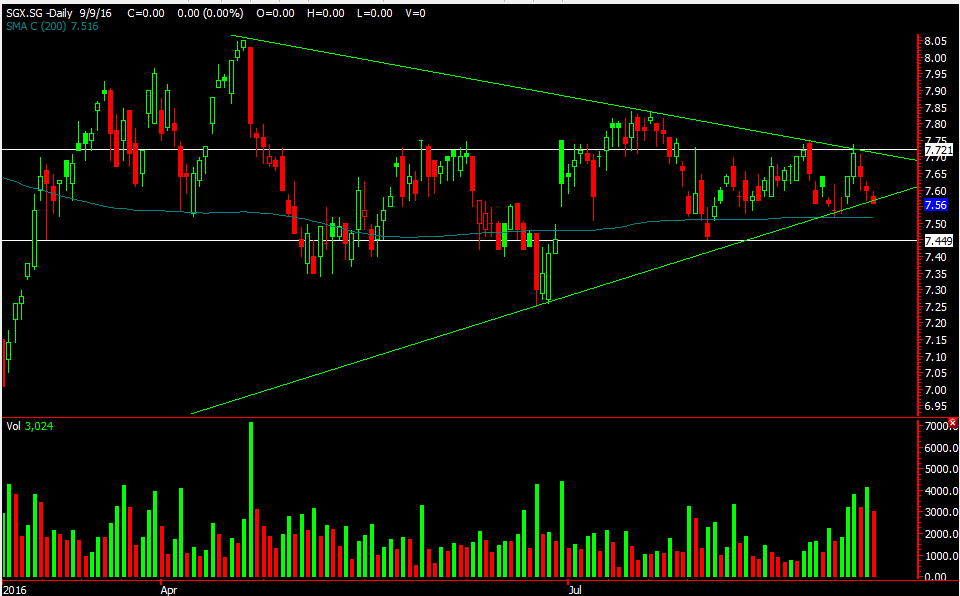
SGX will go XD on 28 sept 2016 so do take note of that.

It is currently sitting on the uptrend line but looks like it might be breaking down from it. SGX can be a whippy stock so do take note ya. If it breaks the uptrend line more downside could be seen to the 200ma at 7.51 then to the horizontal support of 7.44 . Please take note of your stop loss too. A break above 7.75 might signal more upside and that’s where a stop loss can be placed.

Yours
Humbly

SGX, Sino G

13th July, 2016, 1:49 PM
SGX July 2016
SGX July 2016

SGX, it managed to recover to hit back into its uptrend line which shows strength and furthermore its candle today has a nice rebound pattern kind of like a hammer candle.

With that we might see more upside to 7.95. A stop loss could be placed at 7.71 while an entry is one pip above today’s high.

SINO Grandness July 2016

Sino G , worth taking a look. Supported by its uptrend line and being resisted by the 40 and 50ma. A clear of those resistance at 0.65 might see it move to 0.66 and then move up to the second uptrend line at 0.71. There was  a spike in volume today too which caught our attention. An anticipation entry can be at 0.655 and staying in till it hit our resistance line. Stop loss would be at 0.595.

Yours

Humbly