Ezra

15th March, 2016, 4:15 PM
Ezra Mar 2016
Ezra Mar 2016

Its late into the night and thought of updating the blog, of course we don’t encourage people to be working so late into the night. Remember work life balance =) so we’ll try not to update this late in future. Haha

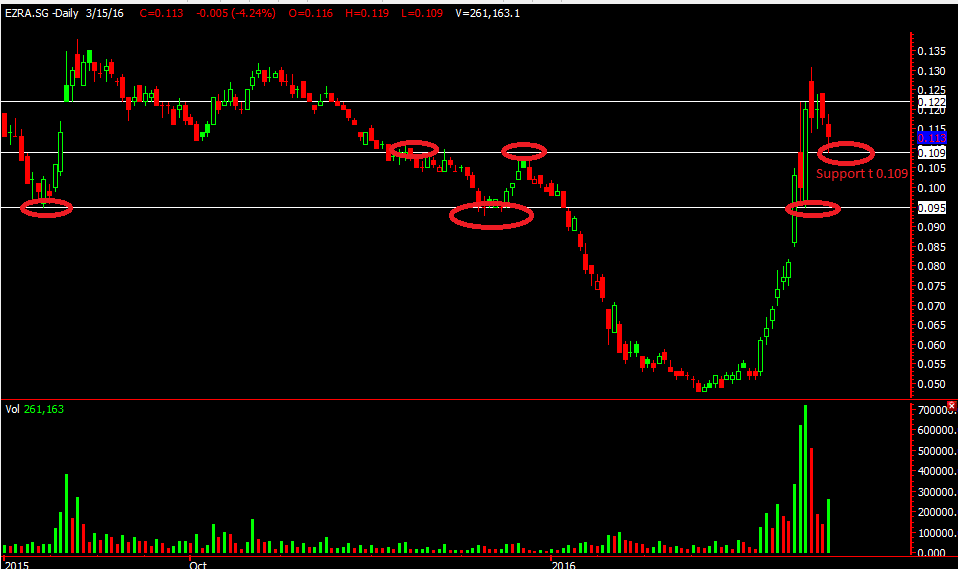
Ezra, an oil related counter had recently seen a strong rebound due to the rebound in oil. It had met with the horizontal resistance at 0.122, it tried to break it a few times but failed to stay above. With that we might either see ezra hovering around 0.109-0.122 area before standing another move.

We’re watching the horizontal support at 0.109 closely and if that breaks we might consider shorting with a stop loss at 0.111 and hopefully a trager of 0.095.

Yours

Humbly
Telcos: M1, Starhub,Singtel

10th March, 2016, 2:12 PM

Mobile data price wars are erupting due to the entry of the fourth telco more can be found in the link below from the straits times.

http://www.straitstimes.com/tech/mobile-data-price-war-erupts-m1-halves-prices-following-singtels-lead

With that we decided to cover the charts for our three local telcos.

First starting with M1

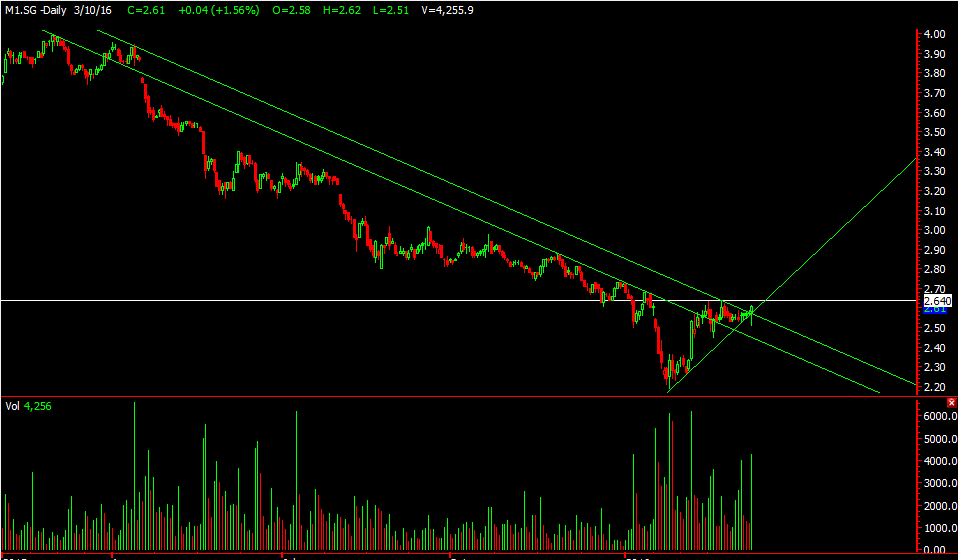
M1 Mar 2016
M1 Mar 2016

Of the three telcos we found this the most interesting. M1, instead of closing down today it actually closed above its opening price.WOW, that shows us some strength when its suppose to be down due to all the price wars which will potentially eat into the telco’s profit. From chart wise, M1 seems to suggest that there might be further upside, with it breaking its downtrend line but does face some resistance at 2.64 if it clears that we might see a nice upside to 2.74 first then 2.87 our cut loss will be at 2.50.

Next up, Starhub

Starhub Mar 2016
Starhub Mar 2016

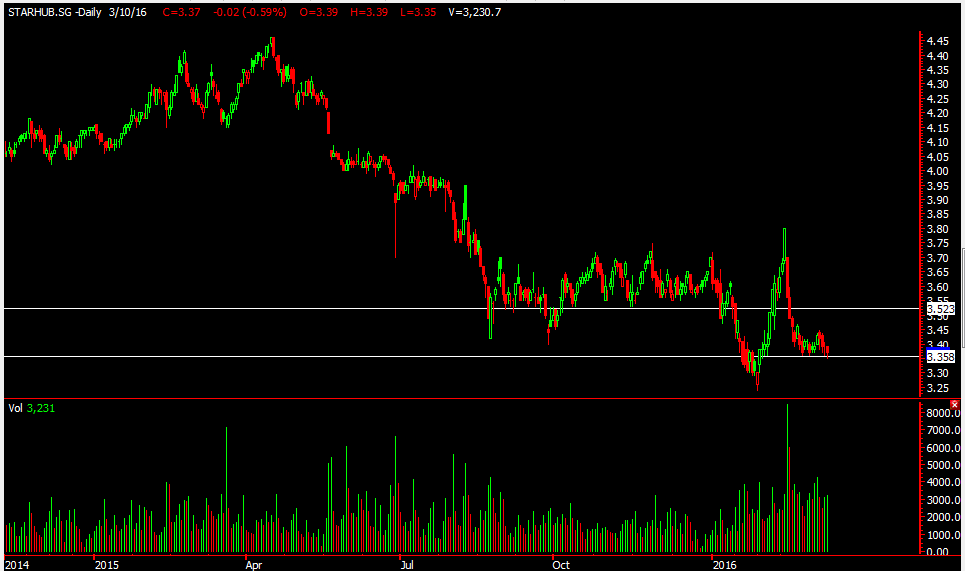
It close down as expected and as u can see is ranging and sitting on its horizontal support of 3.35. If it goes below that we might see more downside to even 3.25 area. We are looking at more downside for Starhub

Last but not Least, Singtel

Singtel Mar 2016
Singtel Mar 2016

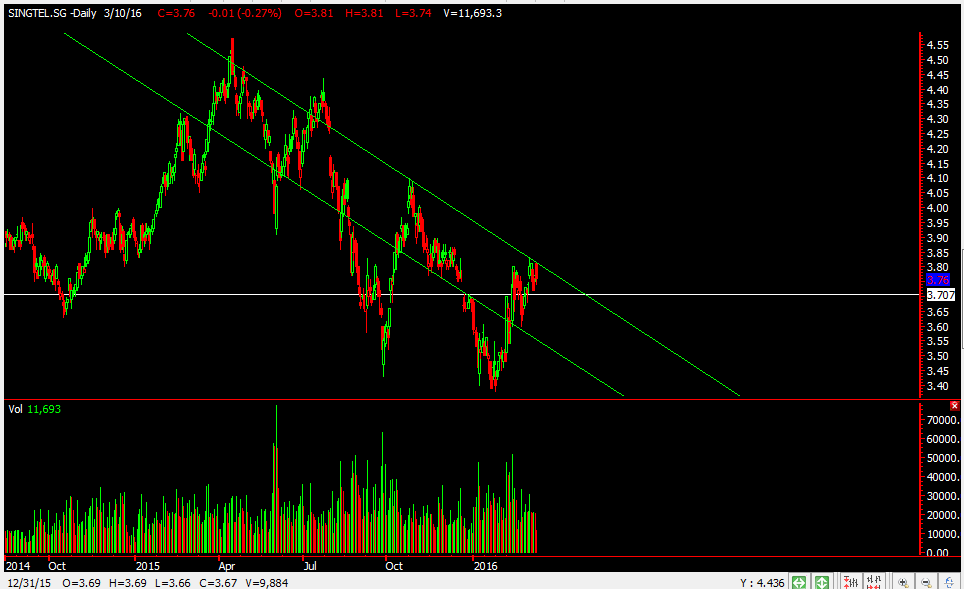
We can see that currently its touching its downtrend line and coming down and we do foresee more downside for Singtel to the horizontal support of 3.70  first then we will plan again.

Yours

Humbly

Noble

8th March, 2016, 11:48 AM
noble Mar 2016
noble Mar 2016

Its mid week and market started to profit take from the strong run up last week.

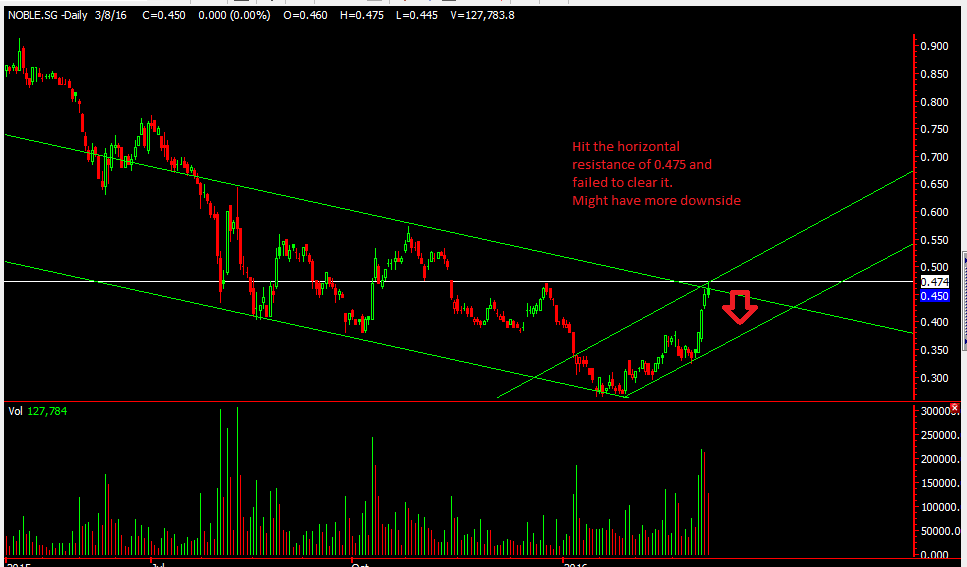
Noble group has hit the horizontal resistance of 0.475 and failed to break through it. It also coincide with some trendlines that we drew. If we were to short , we would short at current price and be prepared to cut loss at 0.48. Its a nice risk reward ratio if we’re aiming to about 0.39 cents as a support. =)

We would use CFDs to short and not do a naked short.

Yours

Humbly

Yuuzoo

3rd March, 2016, 3:02 PM
Yuuzoo Mar 2016
Yuuzoo Mar 2016

It should be a friday morning by the time you all read this and this stock yuuzoo caught our attention. We drew a downtrend line and see that its at quite a major resistance for now. Failure to cross it might see it hover and come down to 0.18 before staging another attempt to break the downtrend line. The closing candle today looks ugly as it open, moved higher and came back down to near to its opening price after reaching near its resistance. this to us is not a good sign.

If we were to short it we would place a stop loss at the downtrend line which is about 0.20. Risk reward looks ok for us.

The weekend is just a day away. Hope you guys had a great week and remember every lesson learnt is not wasted and has a value in it. =)

Yours

Humbly


OCBC

24th February, 2016, 3:14 PM
OCBC Feb 2016
OCBC Feb 2016

OCBC bank has shown some resilience over the past week and has been in range for the last few days. The resistance of 8.08 still hold and unless it breaks above that then we might see it test the downtrend of 8.24. Today candle seems ugly as it went to test the resistance and closed below the open. The immediate support is at 7.92 and a break of that might see further downside. We are anticipating further downside for this counters. Our stop loss would be at 8.08 or even at that downtrend at around 8.24

Have you seen first res since our post?? Its down….

Yours

Humbly


SMRT

21st February, 2016, 3:00 PM
SMRT Feb 2016
SMRT Feb 2016

Its almost the end of the weekend and we hope everyone had a restful and blessed weekend.

As we go back to work on monday and having to take either the train or bus to work this stock SMRT came to our mind.

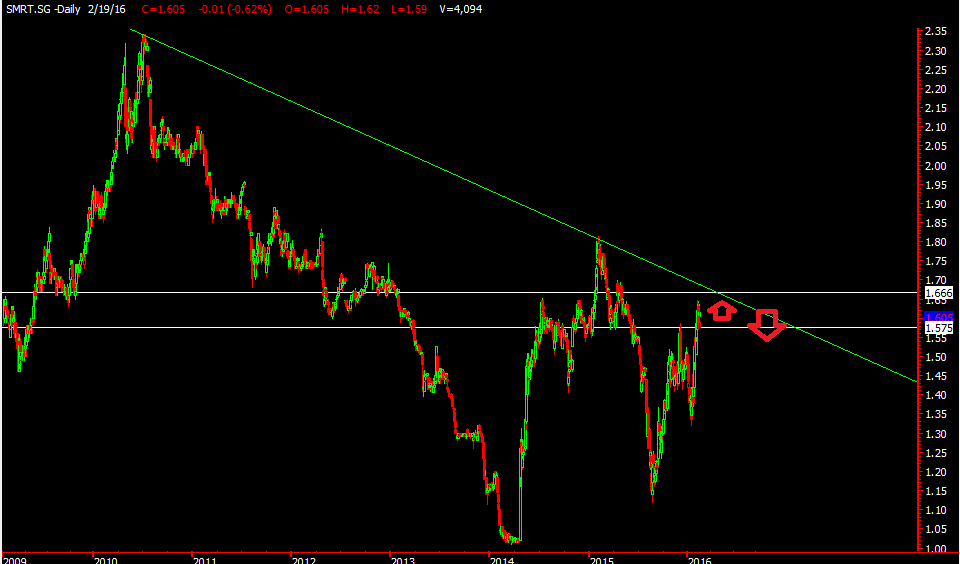
we zoomed out to 2010 and drew a downtrend line connecting the high of 2010  and the high of feb2015 and noticed currently SMRT is near the next downtrend line resistance which is about 1.665. The near immediate support would be 1.575. So how we would play this is either we wait to short at 1.665 area when it hits the downtrend resistance or if it doesn’t touch there and breaks down from 1.575. Our stop loss would be one pip above the resistance or when support broken .

Have a wonderful week ahead and to make the work place a nicer one, how about doing one act of random kindness for someone? =)

Yours

Humbly


Update on First Res

20th February, 2016, 8:36 AM
First Res Feb 2016
First Res Feb 2016

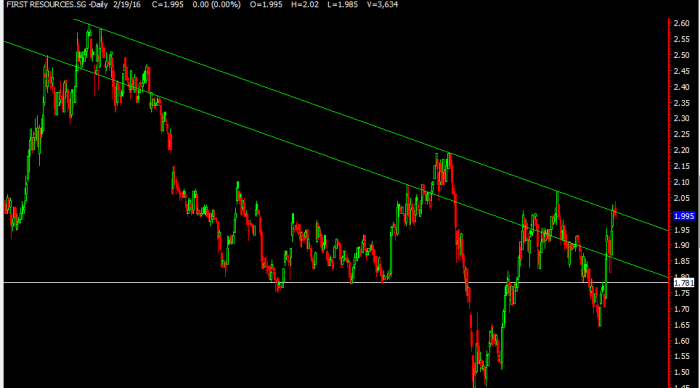
Still remember our post on first res previously? It hit our resistance line in the previous chart and dropped but didn’t drop as much =( as we would have hope for it to so and broke up instead. So if you have placed your stop loss at the resistance line ur loss would have been minimal.

first res.png

Now for an update , it has come up to the longer term downtrend line and once again if you believe in the pattern you would hope for it to start coming down. Like us we are watching to short as it as reached the resistance. Our stop loss would be at $2.04.

Yours

Humbly


Update on STI

20th February, 2016, 8:03 AM

STI

Rally was strong over the week and many have asked what to do and if its time to short.

Well, just to share our thought and the roadmap for STI.

STI currently at 2663 and it seems possible that STI might break above it in the coming days and even test that downtrend line at about 2700 levels. From there we should watch closely to see if it can continue to break to test the resistance levels of 2758 then 2800 . We are not turning bullish but if you like to trade the rebound then maybe just watch those levels. We are waiting to see those levels to plant shorts and will cut if we’re wrong. Our stop loss will be above those resistance lines if we short so that we minimize our loss.

Remember to always have a plan and not trade blindly.


Yours

Humbly

Sembcorp Industry

11th February, 2016, 2:51 PM
Sembcorp Industry Feb 2016

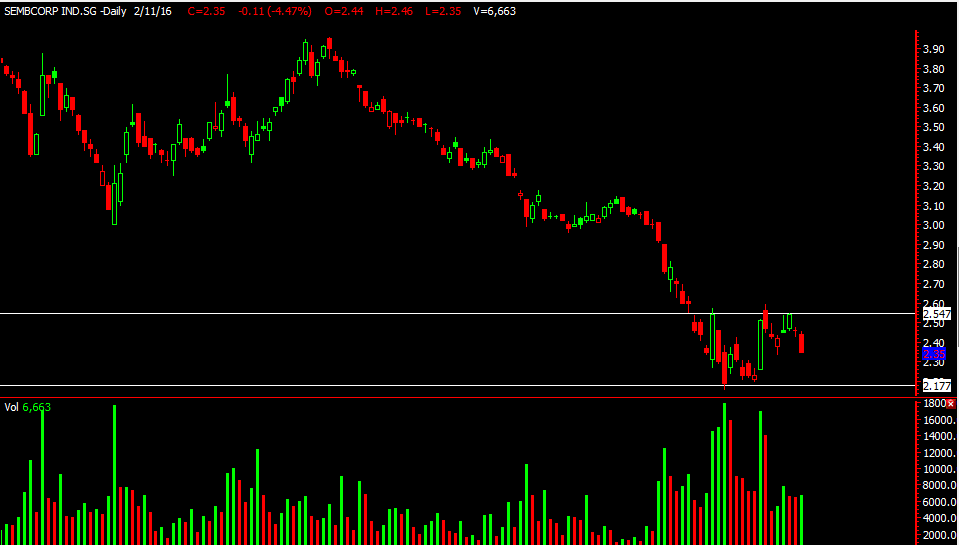
Sembcorp Industry rallied together with the STI last week but failed to break its resistance of $2.54 . With current market sentiment and with oil price sliding below $30 again this counter would be a good candidate for short. There was an increased in volume today with a bearish candlestick forming. We might see it go down to test the support of $2.17 and lets see if the support holds there…If not…………

The chart for sembcorp mar and SGX looks kind of similar, go take a look =)

Yours

Humbly

Wilmar

11th February, 2016, 2:45 PM
Wilmar Feb 2016
Wilmar Feb 2016


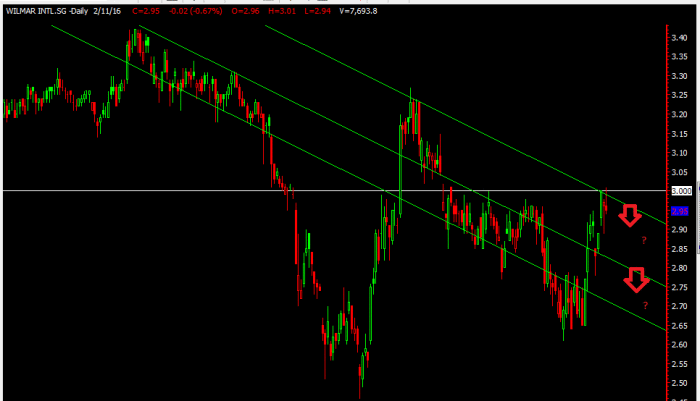
Palm oil counters recently had a good run but with market being weak these counters gain might come to a temporary halt. Wilmar has recently hit its resistance of $3 (a round number that market likes) and seems to be turning down. From our chart, we can see that the horizontal resistance coincides with that downtrend line we drew too. If you were to initiate a short u would want to short around $3 area. Currently it closed at $2.95 today, question is is it too late to short now? Well, it all depends on your risk reward level ya. Your stop loss would be around $3.02-3.03. If the stock does come down we’re hoping it comes down to the second downtrend line  at about $2.82 level and if that breaks then maybe $2.70.

The weekend is near =) time to do some homework over the weekend.


Yours

Humbly