SMRT

21st February, 2016, 3:00 PM
SMRT Feb 2016
SMRT Feb 2016

Its almost the end of the weekend and we hope everyone had a restful and blessed weekend.

As we go back to work on monday and having to take either the train or bus to work this stock SMRT came to our mind.

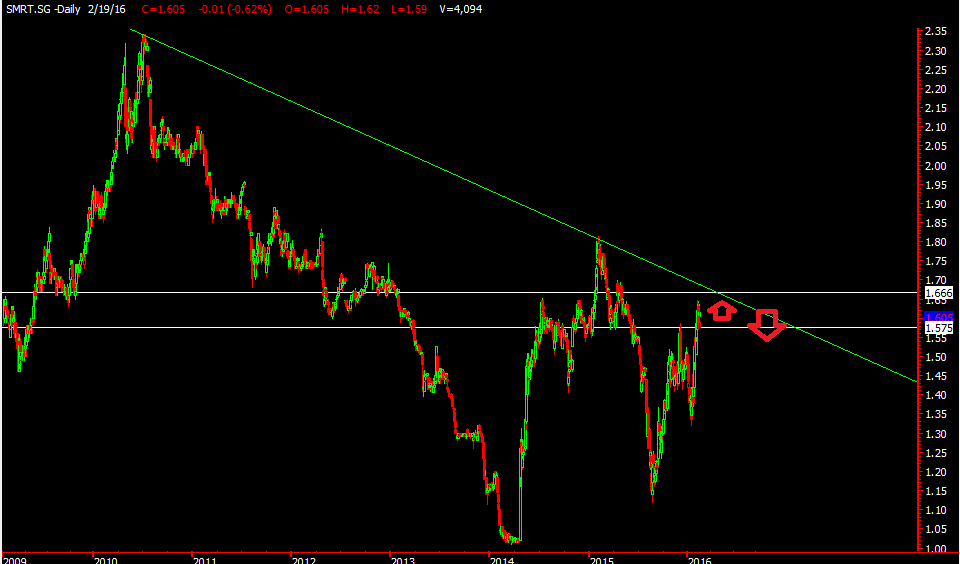
we zoomed out to 2010 and drew a downtrend line connecting the high of 2010  and the high of feb2015 and noticed currently SMRT is near the next downtrend line resistance which is about 1.665. The near immediate support would be 1.575. So how we would play this is either we wait to short at 1.665 area when it hits the downtrend resistance or if it doesn’t touch there and breaks down from 1.575. Our stop loss would be one pip above the resistance or when support broken .

Have a wonderful week ahead and to make the work place a nicer one, how about doing one act of random kindness for someone? =)

Yours

Humbly


Update on First Res

20th February, 2016, 8:36 AM
First Res Feb 2016
First Res Feb 2016

Still remember our post on first res previously? It hit our resistance line in the previous chart and dropped but didn’t drop as much =( as we would have hope for it to so and broke up instead. So if you have placed your stop loss at the resistance line ur loss would have been minimal.

first res.png

Now for an update , it has come up to the longer term downtrend line and once again if you believe in the pattern you would hope for it to start coming down. Like us we are watching to short as it as reached the resistance. Our stop loss would be at $2.04.

Yours

Humbly


Wilmar

11th February, 2016, 2:45 PM
Wilmar Feb 2016
Wilmar Feb 2016


Palm oil counters recently had a good run but with market being weak these counters gain might come to a temporary halt. Wilmar has recently hit its resistance of $3 (a round number that market likes) and seems to be turning down. From our chart, we can see that the horizontal resistance coincides with that downtrend line we drew too. If you were to initiate a short u would want to short around $3 area. Currently it closed at $2.95 today, question is is it too late to short now? Well, it all depends on your risk reward level ya. Your stop loss would be around $3.02-3.03. If the stock does come down we’re hoping it comes down to the second downtrend line  at about $2.82 level and if that breaks then maybe $2.70.

The weekend is near =) time to do some homework over the weekend.


Yours

Humbly

STI

3rd February, 2016, 3:35 PM


STI Feb 2016
STI Feb 2016


Our STI is currently being supported by the horizontal support at 2528 aea which we can see was also the low of 21st jan this year and if we scroll back the low in oct 2011. From the chart we can see its range bound for now between 2528- 2631. But , if this support of 2528 area breaks we might see more downside and if that happens are you ready for more downside? We are! and we hope that you are too! Are you ready to embrace the downside or will you be looking to catch the falling knife and get hurt during the process. Learning how to short this year might be one of the best things to learn this year =)

We are looking to short if STI breaks 2528 with a stop loss of 2530-2535 as a tight stop loss. Blessed day

Yours

Humbly

First Res

2nd February, 2016, 2:52 PM
first res Feb 2016
first res Feb 2016


Lets take a look at this stock called first res. Judging by its pattern , we can see that there is a pattern forming whenever it hits that downtrend line that we drawn it seems to come down and rebound back at the lower channel.

As of now, it seems that it has hit that upper trendline channel at about $1.77, whats next for this stock? Well, if you believe in the patterns then u might say that it might start to come down which we hope so too. =) so if we were to short we would short at about $1.77 and have a tight stop loss of about $1.78-1.795. In this case our risk reward ratio would be a good one if we target $1.62 for our downside target. That works out to about a 5 times risk reward ratio . We risk about 3 cents to try to gain about 15 cents of profit. =) A worthy trade we feel.


Yours humbly

DBS

2nd February, 2016, 2:38 PM

DBS


DBS Feb 2016
DBS Feb 2016


STI had some rebound over the past week but we noticed that the banks didn’t rebound as strongly in fact it was quite weak and started heading down.

With that we see that if the horizontal support of $13.45 is broken we might see DBS heading down to a target of $13.10 first which we have to zoom out to a 15 year time frame to see. The vol for today has increased which might signal some downside pressure.

So what we’ll do now is to wait and see if the support of $13.45 is broken before we initiate a short position. A stop loss of $13.67 can be place for this trade. Remember, as a trader or even investor we have to practice patience.  As we all know patience is a virtue. =) Blessed day ahead


Yours

Humbly

Capitaland

14th January, 2016, 12:47 PM
Capitaland Jan 2016
Capitaland Jan 2016


Capitaland been showing some resilience the last few days despite the market sell off managing to stay above that green uptrend line that we drew  but just for today it seems that capitaland has closed lower than the trendline. Good to take note of it and if it breaks the 3.05 horizontal support we might see it head lower to the next horizontal support line at around 2.92 area first. A Stop loss 3.13 in the position turn against you.Will update more when the time comes

Yours

Humbly

STI

21st September, 2015, 3:26 PM

Just an update on the STI, the last we saw it hit the low of 2837 when it broke our horizontal line of 2877 it didn’t hit our target of 2808 level missing it about 30 points.

With that it seems that STI looks strong but for the moment is in a sideway consolidation mode. Its friday’s closing was below the downtrend line and it seems that we might be testing that first downtrend line again. A break above that might see STI test 2928 level in the coming days. So stay alert. Its an upwards bias from here.

STI Sept 2015
STI Sept 2015

Yours

Humbly

Sembmarine

21st September, 2015, 3:11 PM

Sembmarine testing the downtrend line and closed right at it. With oil recovering in US trade we could see it finally break above that downtrendline, it tried to break it on friday but came back down at closing. If it manages to break above and stay above that downtrend line we might see it test $2.55 in the coming days.

sembmar

Yours

Humbly

Ezion

21st September, 2015, 2:55 PM
Ezion Sept 2015
Ezion Sept 2015

Ezion, having recovered well despite market being down during the day, it had a late day movement and had a nice strong closing. With oil recovering in US trade if oil continue to sustain ezion might have a recovery to 80 cents and even to 0.825-0.83 cents subsequently. From there we will have to see how the market reacts. So be alert once it reaches there.

Yours

Humbly