Sembcorp Industries – [ $1.55 Target Hit! Next Target?? ]

27th October, 2020, 5:57 PM

Sembcorp Industries – [ $1.55 Target Hit! Next Target?? ]Sembcorp Industries 27th Oct 2020

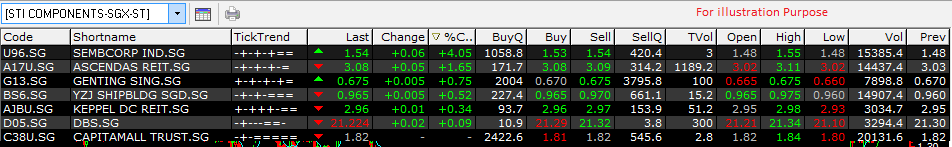
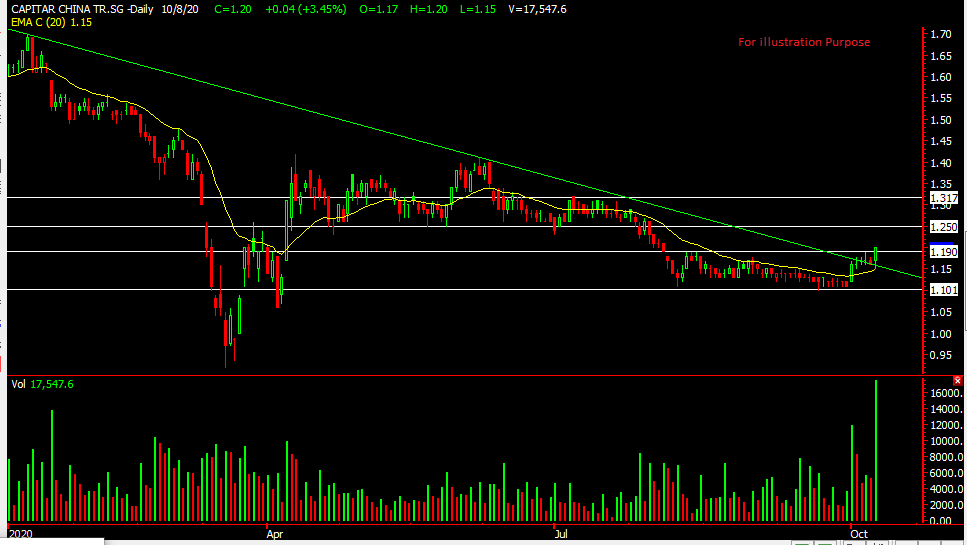
Chart Source: Poemsview 27th Oct 2020

Sembcorp Industries gave us a pleasant surprise and moved up over 4.5% to hit our target of $1.55 just a day after we posted. Once again it bucked the overall trend and emerged top for the STI component.

So now that $1.55 has been hit, what’s our next target? We’re looking at $1.60 then $1.64 but of course not overnight unless Sembcorp Industries decides to surprise us! It’s good to learn how to swing your trade using CFD and not overtrade by going in and out. Learning to have a trailing stop is also important in order to ride your trade. The 10ema would be our support for now.

One suggestion might be the breakout point of $1.46 as ur trailing stop or maybe even $1.50 if u want to protect more of your profit. Remember to always take some profits off the table so you can utilize your funds too.

Want to cut through the noise and get such trade alerts straight to your handphone?

Then be our EXCLUSIVE CLIENT and find out how much value is waiting for you!

See you onboard soon!

Yours

Humbly

Kelwin&Roy


Sembcorp Industries – [ Broke Above $1.46 Resistance, Is $1.55 Possible? ]

26th October, 2020, 7:12 PM

Sembcorp Industries – [ Broke Above $1.46 Resistance, Is $1.55 Possible? ]Sembcorp Industries 26th Oct 2020

Chart Source: Poemsview 26th Oct 2020

Sembcorp Industries once again bucked the overall downtrend today and emerged positive closing up 2%. It’s one of the rare few stocks in the STI component that managed to remain positive and hopefully we’ll see more upside.

It took a nice break consolidating for the past few and breaking out of the $1.46 horizontal resistance despite a down day. This shows strength to us furthermore, there is an increase in volume too. From our previous post, Sembcorp Industries has hit our $1.47 target and we might see $1.52 next. $1.55 might even be possible before it starts taking a break. A sustain in volume is something we’re looking out for in order for this uptrend to continue. We’ll prefer to use poems CFD in order to ride such trades as compared to contra.

Don’t forget election is just about a week plus away!

Want to cut through the noise and get such trade alerts straight to your handphone?

Then be our EXCLUSIVE CLIENT and find out how much value is waiting for you!

See you onboard soon!

Yours

Humbly

Kelwin&Roy


Sembcorp Industries – [ Bucking The Overall Trend Today, More Possible Upside? ]

15th October, 2020, 5:26 PM

Sembcorp Industries – [ Bucking The Overall Trend Today, More Possible Upside? ]


Chart Source: Poemsview 15th Oct 2020

Sembcorp Industries one of the rare few counter that buck the downtrend and closed positive. In fact, it’s the highest percentage gain within the STI component for today.

We’re glad we managed to catch Sembcorp Industries just before it broke out alerting our EXCLUSIVE CLIENTS on Monday when it was trading at $1.34. A nice 10 cents upside which is about 7.5% in a week is a good trade to us! Could Sembcorp Industries continue its run? We think it might be possible given that its strong in a weak market, there is volume coming in and it closed above the $1.40 horizontal resistance.

Our next possible upside is $1.47. But do be cautious, elections is in about 3 weeks, so things could start to get volatile again.

Want to cut through the noise and get such trade alerts straight to your handphone?

Then be our EXCLUSIVE CLIENT and find out how much value is waiting for you!

See you onboard soon!

Yours

Humbly

Kelwin&Roy

Ascendas Reit – [ What Has It Broken Out From? ]

13th October, 2020, 5:10 PM

Ascendas Reit – [ What Has It Broken Out From? ]

Ascendas Reit 13th Oct 2020

Chart Source: Poemsview 13th Oct 2020

Ascendas Reit is a business space and industrial reit which i’m sure many would have seen their spaces all over Singapore. It is also part of the STI component. The Singapore portfolio includes Business and Science parks, High specs industrial & Data Centres. In 2019  ,Ascendas REIT acquired 28 business park properties in three growing US tech-cities. High-specs industrial and data centres make up 17% of its portfolio; with ICT customers contributing 9%, and data centres contributing 5%, to its monthly gross revenue. Data centres like we mentioned in our previous post of Keppel DC Reit is a hot asset in the market. Though Asecndas Reit is not a direct play its good to have a mix of it.

It’s dividend yield is around 4.9% which is decent. So let’s look at it from a technical analysis perspective.

It has broken above its 20 and 50ema which is a positive sign. If you look back, these two moving averages as been acting as the resistance and finally today it managed to break above it. Volume came in too as we can see it’s higher than the last few days. These are positive signs to us.

We have drawn some of the support and resistance level and we might see $3.40 in the coming weeks.

Keep a close watch!

Yours

Humbly

Kelwin&Roy


Keppel DC Reit – [ What Are The Chances Of Testing Previous High? ]

13th October, 2020, 7:07 AM

Keppel DC Reit – [ What Are The Chances Of Testing Previous High? ]Keppel DC Reit 13th Oct 2020

Poemsview : 13th Oct 2020

Keppel DC Reit is an unique asset class on its own and it’s the first pure-play data centre REIT listed in Asia on SGX.

Data centre has been a hot asset and keppel DC Reit has been a beneficiary of it.

From a dividend yield Keppel DC Reit isn’t that attractive of around 2.5% due to the vast increase in price but due to its strong name and financial standing it might be still worth looking at it.

From a technical point of view, it could be in a range with support being at $2.87and the upper limit at $3.07. It has stayed above the 20ema which is a positive sign. What would be good is that the volume could have been more which could indicate a sustained uptrend. Nonetheless, we think Keppel DC Reit stands a good chance to test $3.07 in the near future. It consolidated for the last two weeks and a push to $3.07 could be on the cards. Would prefer a swing for this counter.

Let’s keep a close watch!

Yours

Humbly

Kelwin&Roy


Capitaland Retail China Trust – [ Moved Up 6.5% After Our Post, Still Worth Looking At It? ]

12th October, 2020, 7:00 AM

Capitaland Retail China Trust – [ Moved Up 6.5% After Our Post, Still Worth Looking At It? ] CapitaR China Tr 12th Oct 2020

Chart Source : Poemsview 12th Oct 2020

If you read our blog just last friday we mentioned CaptaR China Tr was a stock that we’re looking at given their new investment strategy and a good dividend yield with a strong sponsor.

Well, just within the day it shot up over 6.5% to reach a day high of $1.28 from the previous day close of $1.20. It’s pretty impressive if you ask us, given that its a reit and we wouldn’t expect to see such a spike up.

So some have been asking, can still buy?? Fundamentally nothing changed overnight and the company is still on track with their expansion so let’s take a look of it from a technical perspective.

CapitaR China Tr has broken out of its downtrend line with a healthy volume and is moving away from that. If you missed this breakout then maybe for a retracement might be an idea. A good retracement might be the test of $1.20 where one can look for some entry again.

There could be more upside room for CapitaR China Tr and you got to ask yourself if you’re comfortable with chasing the stock now.We have drawn the resistance

Our upside target are drawn on the chart and we’re intending for this is to a midterm trade rather than a short term trade.

Don’t forget to subscribe to our blog or you can be our client and be informed of any latest updates.

Yours

Humbly

Kelwin&Roy

Capitaland Retail China Trust – [ Expansion Of Investment Strategy, Worth Looking At It?]

9th October, 2020, 7:00 AM

Capitaland Retail China Trust – [ Expansion Of Investment Strategy, Worth Looking At It?]

Image: CapitaR China Tr presentation slides

Capitaland Retail China Trust or CapitaR China Tr for short is the first and largest China-focused Reit listed in Singapore. They have recently announced an expansion of investment strategy which is turning some heads.

Just a snapshot of what they’ll be doing, they’ll be looking into its investment strategy beyond the retail sector to include office and industrial assets (including business parks, logistics facilities, data centres and integrated developments.) With key focus on long term growth, diversification, resilience, sustainability and returns.

This also shifts its focus from a pure retail play to a more diversified China growth story and might be more attractive for investors, given retail is on a decline and online shopping is gaining strong momentum.

Furthermore data centre are a unique asset and moving into this class of asset is in the right step.

An insert from CapitaR China Tr’s presentation.

More of the presentation slides can be viewed HERE

Let’s take a look at the chart and look at it from a technical analysis perspective.

Chart Source: Poemsview 9th Oct 2020

CapitaR China Tr has actually broken out of its long term downtrend line with one of the biggest volume for the year. It has also broken above its horizontal resistance of $1.19. These are positive technical points for an entry.

It has been consolidating for about two months and so some upside might be expected. We have drawn the resistance levels and a good support should be around $1.10

Our concluding thoughts :

1. Its operating metrics turned positive in Aug and with recovery in sight, we might see more upside

2. Potential addressable pipeline close to $33bn  (from its sponsor CapitaLand)

3. Dividend yield of about 6% which is very decent in today’s market

4. Worth a look for your investment/dividend portfolio with a structured approach in scaling in.

Do contact us if you’ll like to know more!

Yours

Humbly

Kelwin&roy


Capitaland – [ Rebounding Off The Bottom, How Far More Can It Go? ]

6th October, 2020, 3:45 PM

Capitaland – [ Rebounding Off The Bottom, How Far More Can It Go? ]Capitaland 6th oct 2020


Chart Source: Poemsview 6th Oct 2020

Capitaland part of the STI component stock had a nice rebound ever since we mentioned about its base building just last week. It has reached our target of $2.80 in less than a week and experienced some pullback after hitting the resistance. Property counters are generally lagging behind but with strong sales, could these counters start to pick up?

Using technical analysis, for now 2.80 shall be the resistance and if Capitaland can break that we might see it move higher to around $2.86-2.88 which is the 100ema and the horizontal resistance.

Don’t forget to follow us on Investingnote as we do post there frequently too.

Yours

Humbly

Kelwin&roy

Capitaland – [Base Forming? Bottoming? ]

1st October, 2020, 1:34 PM

Capitaland – [Base Forming? Bottoming? ]Capitaland 1st oct 2020

Chart Source: Poemsview 1st Oct 2020

Capitaland seems to have bottomed with a base forming around $2.65 level. The next level of support might be at $2.60. Property counters have been lagging and strong property sales figure have been seen in the last few months. Could property counters start their move up? And could it help to push the STI up as its part of the STI component?

Head over to our post on investing notes to know more. Watching Capitaland with interest.

Yours

Humbly

Kelwin&Roy

Singapore Local Banks – [ Low Enough For A Rebound? ]

24th September, 2020, 8:09 AM

Singapore Local Banks – [ Low Enough For A Rebound? ]DBS 24th Sept 2020

Chart Source: Poemsview 24th Sept 2020

Our three local banks has been on a downtrend for awhile due to the weaker economic data, bleak outlook and a low interest rate environment too. The downward pressure has been rather strong and the question is, is the end in sight? Also, as the three banks take up a rather big weightage in the STI, how the STI moves depends quite a bit on how these banks move too.

Let’s take a look at our first bank DBS.

From the chart, we MIGHT see a temporary short term support at around $19.50 area which is our horizontal support. A nice strong candle appeared yesterday and this bounce might take us to our downtrend line or maybe even to $20.60-20.80. From there on, downwards pressure might start to come back in.  A good level to start considering scaling in might be around $19.


OCBC 24th Sept 2020

OCBC similar to DBS has also seen some support at the horizontal support of around $8.38. If this bullish momentum can carry on we might see OCBC break out from that downtrend line and maybe even to $8.7 and $8.9 if market remains well. After that we might see downwards pressure coming  in. A good strong support might be at around $8.


UOB 24th Sept 2020

UOB is rather interesting. It actually broke the downtrend line, hover a few days and came down and actually tested the downtrend which became a support. The near term resistance might be $19.34 breaking which we might see $19.74 and maybe even $20.30. A good strong support is around $18.19.

Want to know more about our three local banks?

Just simply drop us a message and we’ll be happy to discuss more.

Yours

Humbly

Kelwin&Roy