Sembcorp Industry

11th February, 2016, 2:51 PM
Sembcorp Industry Feb 2016

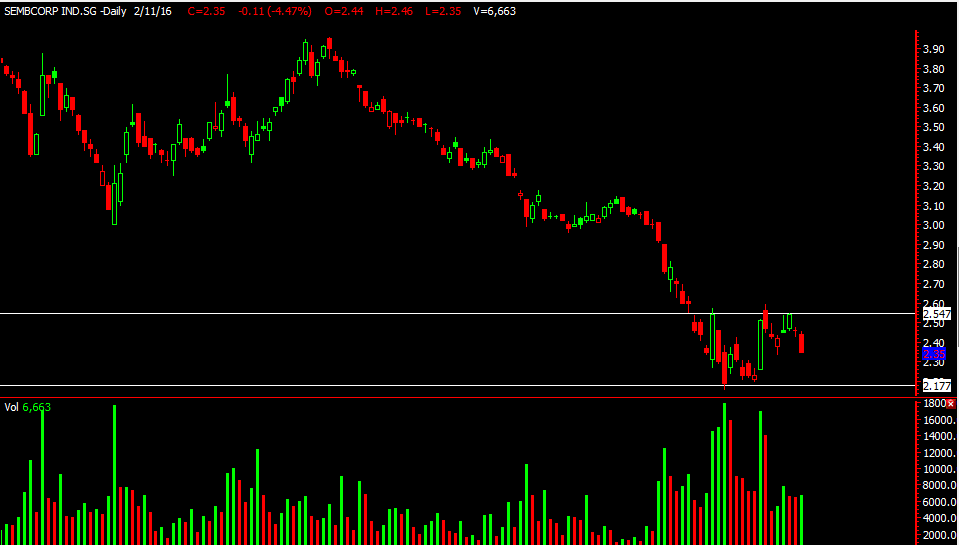
Sembcorp Industry rallied together with the STI last week but failed to break its resistance of $2.54 . With current market sentiment and with oil price sliding below $30 again this counter would be a good candidate for short. There was an increased in volume today with a bearish candlestick forming. We might see it go down to test the support of $2.17 and lets see if the support holds there…If not…………

The chart for sembcorp mar and SGX looks kind of similar, go take a look =)

Yours

Humbly

Follow and like us:

Wilmar

11th February, 2016, 2:45 PM
Wilmar Feb 2016
Wilmar Feb 2016


Palm oil counters recently had a good run but with market being weak these counters gain might come to a temporary halt. Wilmar has recently hit its resistance of $3 (a round number that market likes) and seems to be turning down. From our chart, we can see that the horizontal resistance coincides with that downtrend line we drew too. If you were to initiate a short u would want to short around $3 area. Currently it closed at $2.95 today, question is is it too late to short now? Well, it all depends on your risk reward level ya. Your stop loss would be around $3.02-3.03. If the stock does come down we’re hoping it comes down to the second downtrend line  at about $2.82 level and if that breaks then maybe $2.70.

The weekend is near =) time to do some homework over the weekend.


Yours

Humbly

Follow and like us:

STI

3rd February, 2016, 3:35 PM


STI Feb 2016
STI Feb 2016


Our STI is currently being supported by the horizontal support at 2528 aea which we can see was also the low of 21st jan this year and if we scroll back the low in oct 2011. From the chart we can see its range bound for now between 2528- 2631. But , if this support of 2528 area breaks we might see more downside and if that happens are you ready for more downside? We are! and we hope that you are too! Are you ready to embrace the downside or will you be looking to catch the falling knife and get hurt during the process. Learning how to short this year might be one of the best things to learn this year =)

We are looking to short if STI breaks 2528 with a stop loss of 2530-2535 as a tight stop loss. Blessed day

Yours

Humbly

Follow and like us:

First Res

2nd February, 2016, 2:52 PM
first res Feb 2016
first res Feb 2016


Lets take a look at this stock called first res. Judging by its pattern , we can see that there is a pattern forming whenever it hits that downtrend line that we drawn it seems to come down and rebound back at the lower channel.

As of now, it seems that it has hit that upper trendline channel at about $1.77, whats next for this stock? Well, if you believe in the patterns then u might say that it might start to come down which we hope so too. =) so if we were to short we would short at about $1.77 and have a tight stop loss of about $1.78-1.795. In this case our risk reward ratio would be a good one if we target $1.62 for our downside target. That works out to about a 5 times risk reward ratio . We risk about 3 cents to try to gain about 15 cents of profit. =) A worthy trade we feel.


Yours humbly

Follow and like us:

DBS

2nd February, 2016, 2:38 PM

DBS


DBS Feb 2016
DBS Feb 2016


STI had some rebound over the past week but we noticed that the banks didn’t rebound as strongly in fact it was quite weak and started heading down.

With that we see that if the horizontal support of $13.45 is broken we might see DBS heading down to a target of $13.10 first which we have to zoom out to a 15 year time frame to see. The vol for today has increased which might signal some downside pressure.

So what we’ll do now is to wait and see if the support of $13.45 is broken before we initiate a short position. A stop loss of $13.67 can be place for this trade. Remember, as a trader or even investor we have to practice patience.  As we all know patience is a virtue. =) Blessed day ahead


Yours

Humbly

Follow and like us:

Capitaland

14th January, 2016, 12:47 PM
Capitaland Jan 2016
Capitaland Jan 2016


Capitaland been showing some resilience the last few days despite the market sell off managing to stay above that green uptrend line that we drew  but just for today it seems that capitaland has closed lower than the trendline. Good to take note of it and if it breaks the 3.05 horizontal support we might see it head lower to the next horizontal support line at around 2.92 area first. A Stop loss 3.13 in the position turn against you.Will update more when the time comes

Yours

Humbly

Follow and like us:

STI

21st September, 2015, 3:26 PM

Just an update on the STI, the last we saw it hit the low of 2837 when it broke our horizontal line of 2877 it didn’t hit our target of 2808 level missing it about 30 points.

With that it seems that STI looks strong but for the moment is in a sideway consolidation mode. Its friday’s closing was below the downtrend line and it seems that we might be testing that first downtrend line again. A break above that might see STI test 2928 level in the coming days. So stay alert. Its an upwards bias from here.

STI Sept 2015
STI Sept 2015

Yours

Humbly

Follow and like us:

Sembmarine

21st September, 2015, 3:11 PM

Sembmarine testing the downtrend line and closed right at it. With oil recovering in US trade we could see it finally break above that downtrendline, it tried to break it on friday but came back down at closing. If it manages to break above and stay above that downtrend line we might see it test $2.55 in the coming days.

sembmar

Yours

Humbly

Follow and like us:

Ezion

21st September, 2015, 2:55 PM
Ezion Sept 2015
Ezion Sept 2015

Ezion, having recovered well despite market being down during the day, it had a late day movement and had a nice strong closing. With oil recovering in US trade if oil continue to sustain ezion might have a recovery to 80 cents and even to 0.825-0.83 cents subsequently. From there we will have to see how the market reacts. So be alert once it reaches there.

Yours

Humbly

Follow and like us:

STI

5th September, 2015, 7:56 AM

The STI broke it’s immediate support of 2877 on friday and saw selling throughout the day. With Dow closing lower on friday night we might expect the STI to move down and retest the previous support of 2808 level and if a break of that we might even see it go lower to test 2756 area and depending how bad the markets might be we will then update then again.

STI Sept 2015
STI Sept 2015

Yours Humbly

Follow and like us: