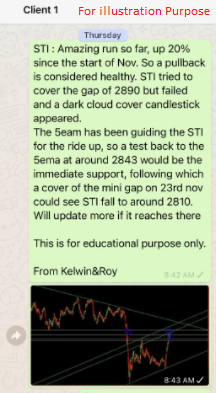
Straits Times Index – [The Road Ahead]
Chart Source: AdvisorXs 30th Aug 2021
Familiar with the NDP theme song the road ahead by now? Such a hit and very relatable as Sinagporeans navigate through the road ahead with courage and determination.
So what’s the road ahead like for our Straits Times Index? Is is choppy? Or is it a smooth ride ahead? Well, lets take a look at the chart to get some idea. From a technical analysis perspective, STI is currently sitting on its horizontal support of around 3080 level. This coincides with the support of around March but if this support doesn’t hold we might see a further leg down to 3050 and if weakness persist, 3020 is the area of the previous gap cover. 3020 would be a key support for us but we’re hoping it doesn’t go there. For the upside, STI has to break our downtrend line first as a first sign of strength and also the 5ema of around 3100. That would signal strength and as Fed gets the market ready for its bond tapering this year, we are keeping track to see how other market reacts as the sentiments will flow over to Asia. Some upside resistance might be around 3120 then 3160 and 3200.
The road ahead might not be easy but with an extra pair of eyes, the journey need not be so arduous.
Want a pair of remisiers to help guide and guard against pitfalls? Or even receiving timely trading alerts on potential stocks?
Drop us a message to see how you can be included in our growing trading community.
Yours
Humbly
Kelwin&Roy