ComfortDelgro – [ Are You Riding The Recovery Wave? What Else is Causing A Spike? ]

16th August, 2021, 4:04 PM

ComfortDelgro – [ Are You Riding The Recovery Wave? What Else is Causing A Spike? ]

Just last Friday Evening ( 13th Aug) ComfortDelgro reported its earnings of $91 million, versus a net loss of $6.6 million the previous year. Revenue in the same period was up 13.6% y-o-y to $1.74 billion, with growth seen across its various segments ranging from taxis to bus operations.

The pandemic took a toll on many sectors like transport, hospitality , retail reits but as we continue to adapt these stocks are slowly coming back. With Singapore vaccine rate at 75% now, more and more areas are being open up and our economy is starting to get back on track.

Not only that, ComfortDelgro is seeking an IPO listing in Australia for its Australian subsidiary which also gave the stock price a boost hitting our first target price in just 2 trading days. Where to now? From the chart below , our resistance is drawn at $1.71 then 1.76, will update more if those targets are hit. Volume is one of the biggest for the past few months and this might help sustain an up move in the coming days.

ComfortDelgro 16th Aug2021

Chart Source: AdvisorXs 16th Aug 2021

ComfortDelgro as been kind to us for the last few months as we caught a nice up wave for it.

Want such trade alert sent to your handphone straight? Want to join a growing pool of community of like minded traders?

Want to know what stock we’re looking at next?

Be our EXCLUSIVE CLIENT and be alerted earlier to not miss out!

Yours

Humbly

Kelwin&Roy

Why This Stock Went Against Market Sentiments , Should You Chase It?

13th August, 2021, 7:57 PM

Why This Stock Went Against Market Sentiments , Should You Chase It? Apac Realty 13th Aug 2021

Chart source: AdvisorXs 13th Aug 2021

This property stock went against the general market sentiments and even went up 10% today!

APAC REALTY went against all odds and closed up despite negative sentiments around. Even its counterpart Propnex didn’t manage to close up and went down instead. So why did Apac Realty move up that much and should one chase it now?

For one, it had a good set of results. Fueled by strong demand from local buyers, revenue jumped 121% y-o-y to $358.4 million, while earnings surged 107.4% in the same period to hit just over $17 million. Earnings per share stood at 4.8 Singapore cents, while net asset value per share stood at 46.6 cents, as at June 30, 2021.

The group declared an interim dividend of 3.5 Singapore cents, representing a payout ratio of 73 per cent, and a one-off special dividend of 3cents per share. This brings the total dividend to 6.5 cents. As a dividend hungry Nation, this  probably caused a spike in price as investors chased the dividend.  We saw a gap up in the morning and for those who didn’t enter this trade started to chase. This also helped us in achieving our first profit target of $0.875

Singapore’s housing market continues to remain strong for the past year due to the delay in new built and BTOs. Developers have sold 7,601 private residential units (including executive condominium units) in H1 FY2021, up 68.1 per cent from 4,532 units sold in H1 FY2020, figures from the Urban Redevelopment Authority showed. Some analysts have suggested that sales volume in the primary market could climb as high as 12,000 units this year. This could be a driver for an increased in the stock price BUT we are rather cautious now as prices has risen for APAC Realty.

Our community of traders have received an earlier alert this week as shown from the message above and as traders pile in, we were looking to take profits instead. We wouldn’t want to add or chase the price now but prefer to take some profits off the table as prices rise. So what is key is getting in a trade and not chasing it as this doesn’t put you in a favourable stance.

Want to join a growing pool of community of like minded traders? Want such trade alert sent to your handphone straight?

Want to know what stock we’re looking at next?

Be our EXCLUSIVE CLIENT and be alerted earlier to not miss out!

Yours

Humbly

Kelwin&Roy


Pinterest (PINS) : [ Technical Outlook]

12th August, 2021, 6:09 PM

Pinterest (PINS) : [ Technical Outlook]

Chart Source: Tradingview.com 12th aug 2021

Pinterest (PINS) is an American image sharing and social media service designed to enable saving and discovery of information on the internet using images and, on a smaller scale, animated GIFs and videos, in the form of pinboards. During the pandemic, as more people was forced to stay home, Pinterest along with many other stock home stocks all saw a vey good run up but as the economy starts to open up these once loved stay home stocks are taking a beating.

PINS saw about a 27% drop in their share price since the high in Feb and the recent gap down in late July was due to a disappointing results. It was more of their user growth that disappointed  falling 5% year over year to 91 million but weakness in this area was expected as the economy was reopening. However, Pinterest had guided for U.S. MAUs (Monthly activate users to be roughly flat with the year-ago period but the 5% was worse than what investors expected hence a sell down

Moving into the next quarter, the company didn’t provide an outlook for third-quarter MAUs, citing uncertainties surrounding the pandemic. However, in the earnings release, it said: “Engagement headwinds on Pinterest have continued in July.

Technical Perspective :

So lets take a look at the chart and see what might happen to Pins. We can see support at around the $55.60 level where it bounced off last night and regained from footing at the $56.80 level. The previous support in May was also around the $56 level and after consolidating there it started to move up. We might see some similarity now, so some consolidation and a move up to $60 first. There is the gap resistance and if momentum manages to push through we might start seeing it move to $65. This is more of a rebound trade and possible some short squeeze if the price starts to bounce back. The next support level is at $52.

What’s your thoughts on Pinterest? Share it with us, we’ll love to hear it.

Yours

Humbly

Kelwin&Roy

IFast – [ Why Did It Move Up So Fast? Renewed Interest? ]

11th August, 2021, 7:14 PM

IFast – [ Why Did It Move Up So Fast? Renewed Interest? ]IFast 11th Aug 2021

Chart Source: AdvisorXs 11th Aug 2021

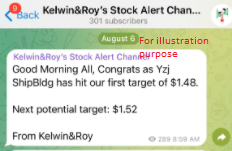
From the above message we can see the speed and momentum of IFast in the morning! What a jump in price as IFast finally broke its 20ema  at $8.56 this morning and never looked back after. It’s probably one of our fastest trade that we seen, hitting our first target price of $8.84 in under an hour! The overall market was lackluster despite Dow having a good finish. The importance of choosing the correct stock can give one the mental confidence and boost your clarity in the next trade.

So lets take a look at IFast chart and analyze it from a technical perspective. From the chart, we can see it has broken above its downtrend line and also its 20ema, volume has also increased and its the highest for the week so far. These are bullish signal to us and we might likely see it move up to our second target of $9.12. Immediate resistance might be around $9 as there is a gap resistance over there too. So do note that prices might start pulling back there first.

If you would like to know how to receive such trade alerts sent to your handphone, just drop us a message and we’ll walk you through it

Want to be alerted earlier before the breakout?

Want to know what stock we’re looking at next?

Be our EXCLUSIVE CLIENT and be alerted earlier to not miss out!

Yours

Humbly

Kelwin&Roy


Sinostar Pec – [ Start Of A New Uptrend Wave? ]

10th August, 2021, 7:30 PM

Sinostar Pec – [ Start Of A New Uptrend Wave? ]Sinostar Pec 10th Aug 2021

Chart Source: AdvisorXs 10th Aug 2021

Sinostar Pec is one of the largest producers and suppliers of downstream petrochemical products within 400km radius of is production facilities within the Dongming Petrochem Industrial Zone in Dongming County of Shandong Province, PRC.

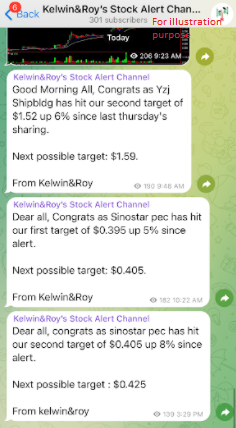
It had some movement just over a week ago when we first spotted it and finally it started to show its true colours today!

A nice consolidation for the past few weeks led to a nice breakout with volume which resulted in a 8% upswing from our entry! With such a move , a new uptrend might be forming and 0.425 target is within sight now. With an increased in volume we might even see $0.45. Watch out for the break and momentum!

If you would like to know how to receive such trade alerts sent to your handphone, just drop us a message and we’ll walk you through it

Want to be alerted earlier before the breakout?

Want to know what stock we’re looking at next?

Be our EXCLUSIVE CLIENT and be alerted earlier to not miss out!

Yours

Humbly

Kelwin&Roy

Yzj ShipBldg – [ Sleepy Giant Wakes Up, Where To Take Profit? ]

10th August, 2021, 5:22 PM

Yzj ShipBldg – [ Sleepy Giant Wakes Up, Where To Take Profit? ]Yzj ShipBldg 10th Aug 2021

Chart source: AdvisorXs 10th Aug2021

Yzj ShipBldg has finally made a move after a long consolidation of around 2 months. It has made a clean breakout of the $1.45 horizontal resistance with a strong gap up last Friday with an increased in volume. As a trader, with the gap up we might find it hard to chase as our stop loss would be higher, the risk reward for the trade is also not as good hence an earlier entry might be one of the solution.

A pre-break of the horizontal line of $1.42 was actually a que to us as we saw some volume coming in and we decided to alert our EXCLUSIVE CLIENTS on Telegram about it! With an entry at $1.43 we saw a nice 6% upside in just 2 trading days!

So where to take profit? The $1.52-1.54 is quite an obvious resistance so taking some profit around this area is something a trader might consider. Or wait for a break of this $1.54 which might lead to a higher price of $1.59 or a fake breakout, consolidate and move higher in the next few weeks.

So these are some of our game plan and we’re watching to see how it pans out.

If you would like to know how to receive such trade alerts sent to your handphone, just drop us a message and we’ll walk you through it

Want to be alerted earlier before the breakout?

Want to know what stock we’re looking at next?

Be our EXCLUSIVE CLIENT and be alerted earlier to not miss out!

Yours

Humbly

Kelwin&Roy


UMS -[ $1.75 Target Met, Can It Still Go Higher? ]

5th August, 2021, 3:09 PM

UMS -[ $1.75 Target Met, Can It Still Go Higher? ]

Chart Source: AdvisorXs 5th Aug2021

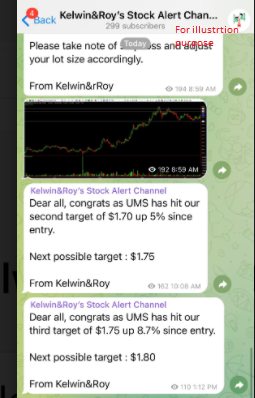
Another leg up for UMS as it burst out from the $1.70 resistance. From our previous post, we mentioned that $1.70 was the resistance and a break of that might see $1.75 which we witnessed today. A good start to the day we say!

$1.75 does look like a stronger resistance but with the increase renew interested and volume, we might see $1.80 in the coming days. It is at its all time high so we’re looking at an ugly candle or reversal candle to indicate weakness. Its also wise to take profit along the way now.

If you would like to know how to receive such trade alerts sent to your handphone, just drop us a message and we’ll walk you through it

Want to be alerted earlier before the breakout?

Want to know what stock we’re looking at next?

Be our EXCLUSIVE CLIENT and be alerted earlier to not miss out!

Yours

Humbly

Kelwin&Roy


UMS – [ All Time High! How Much Higher? ]

2nd August, 2021, 9:27 PM

UMS – [ All Time High! How Much Higher? ]

Chart source: AdvisorXs 2nd Aug 2021

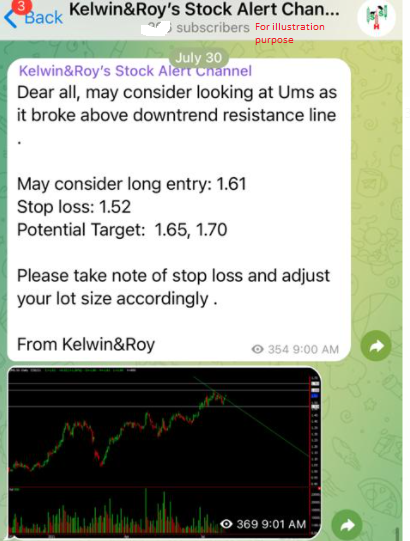
UMS continued its uptrend today and made an all time high before closing at its previous high of $1.65. The volume today wasn’t was much as we would have expected it to be, a healthier scenario would be for volume to more than friday’s. But we can’t get everything right? At least it has hit our first target of $1.65.  🤑🤑 As $1.65 is our resistance, UMS has just nice closed at that price but we might still see more upside in the coming days and might march up to $1.70. After that $1.75 area might be on the cards.

UMS has been good to us for this year ever since our first spot back in march when UMS was just trading at $1.11. If you were an investor and held your trade through then big congrats to you!

If you would like to know how to receive such trade alerts sent to your handphone, just drop us a message and we’ll walk you through it

Want to be alerted earlier before the breakout?

Want to know what stock we’re looking at next?

Be our EXCLUSIVE CLIENT and be alerted earlier to not miss out!

Yours

Humbly

Kelwin&Roy


Tesla – [ Watching That $700 Resistance]

2nd August, 2021, 4:49 PM

Tesla – [ Watching That $700 Resistance]Tesla 2nd Aug 2021

Chart source: Tradingview.com

Tesla ranging around the $620 to $700 area for the past month or so. We’re looking for a good clean break of the $700 resistance which might take us to $750 in the coming weeks. An increase in volume would add conviction to this breakout. It has actually broken above its mid-term downtrend line which is a positive for us but breaking above $700 would be an added bonus.

We’re looking to see Immediate support at $650 then $620.

What’s your take on Tesla? Do drop us a message. =)

Yours

Humbly

Kelwin&Roy