Did you know that the S&P500 ended April up close to 2% further adding to April being a positive month for the markets.
Now as we enter May. What is ahead of us? Firstly, Fed will be meeting on 2nd and 3rd May deciding if they will raise interest rates once again.
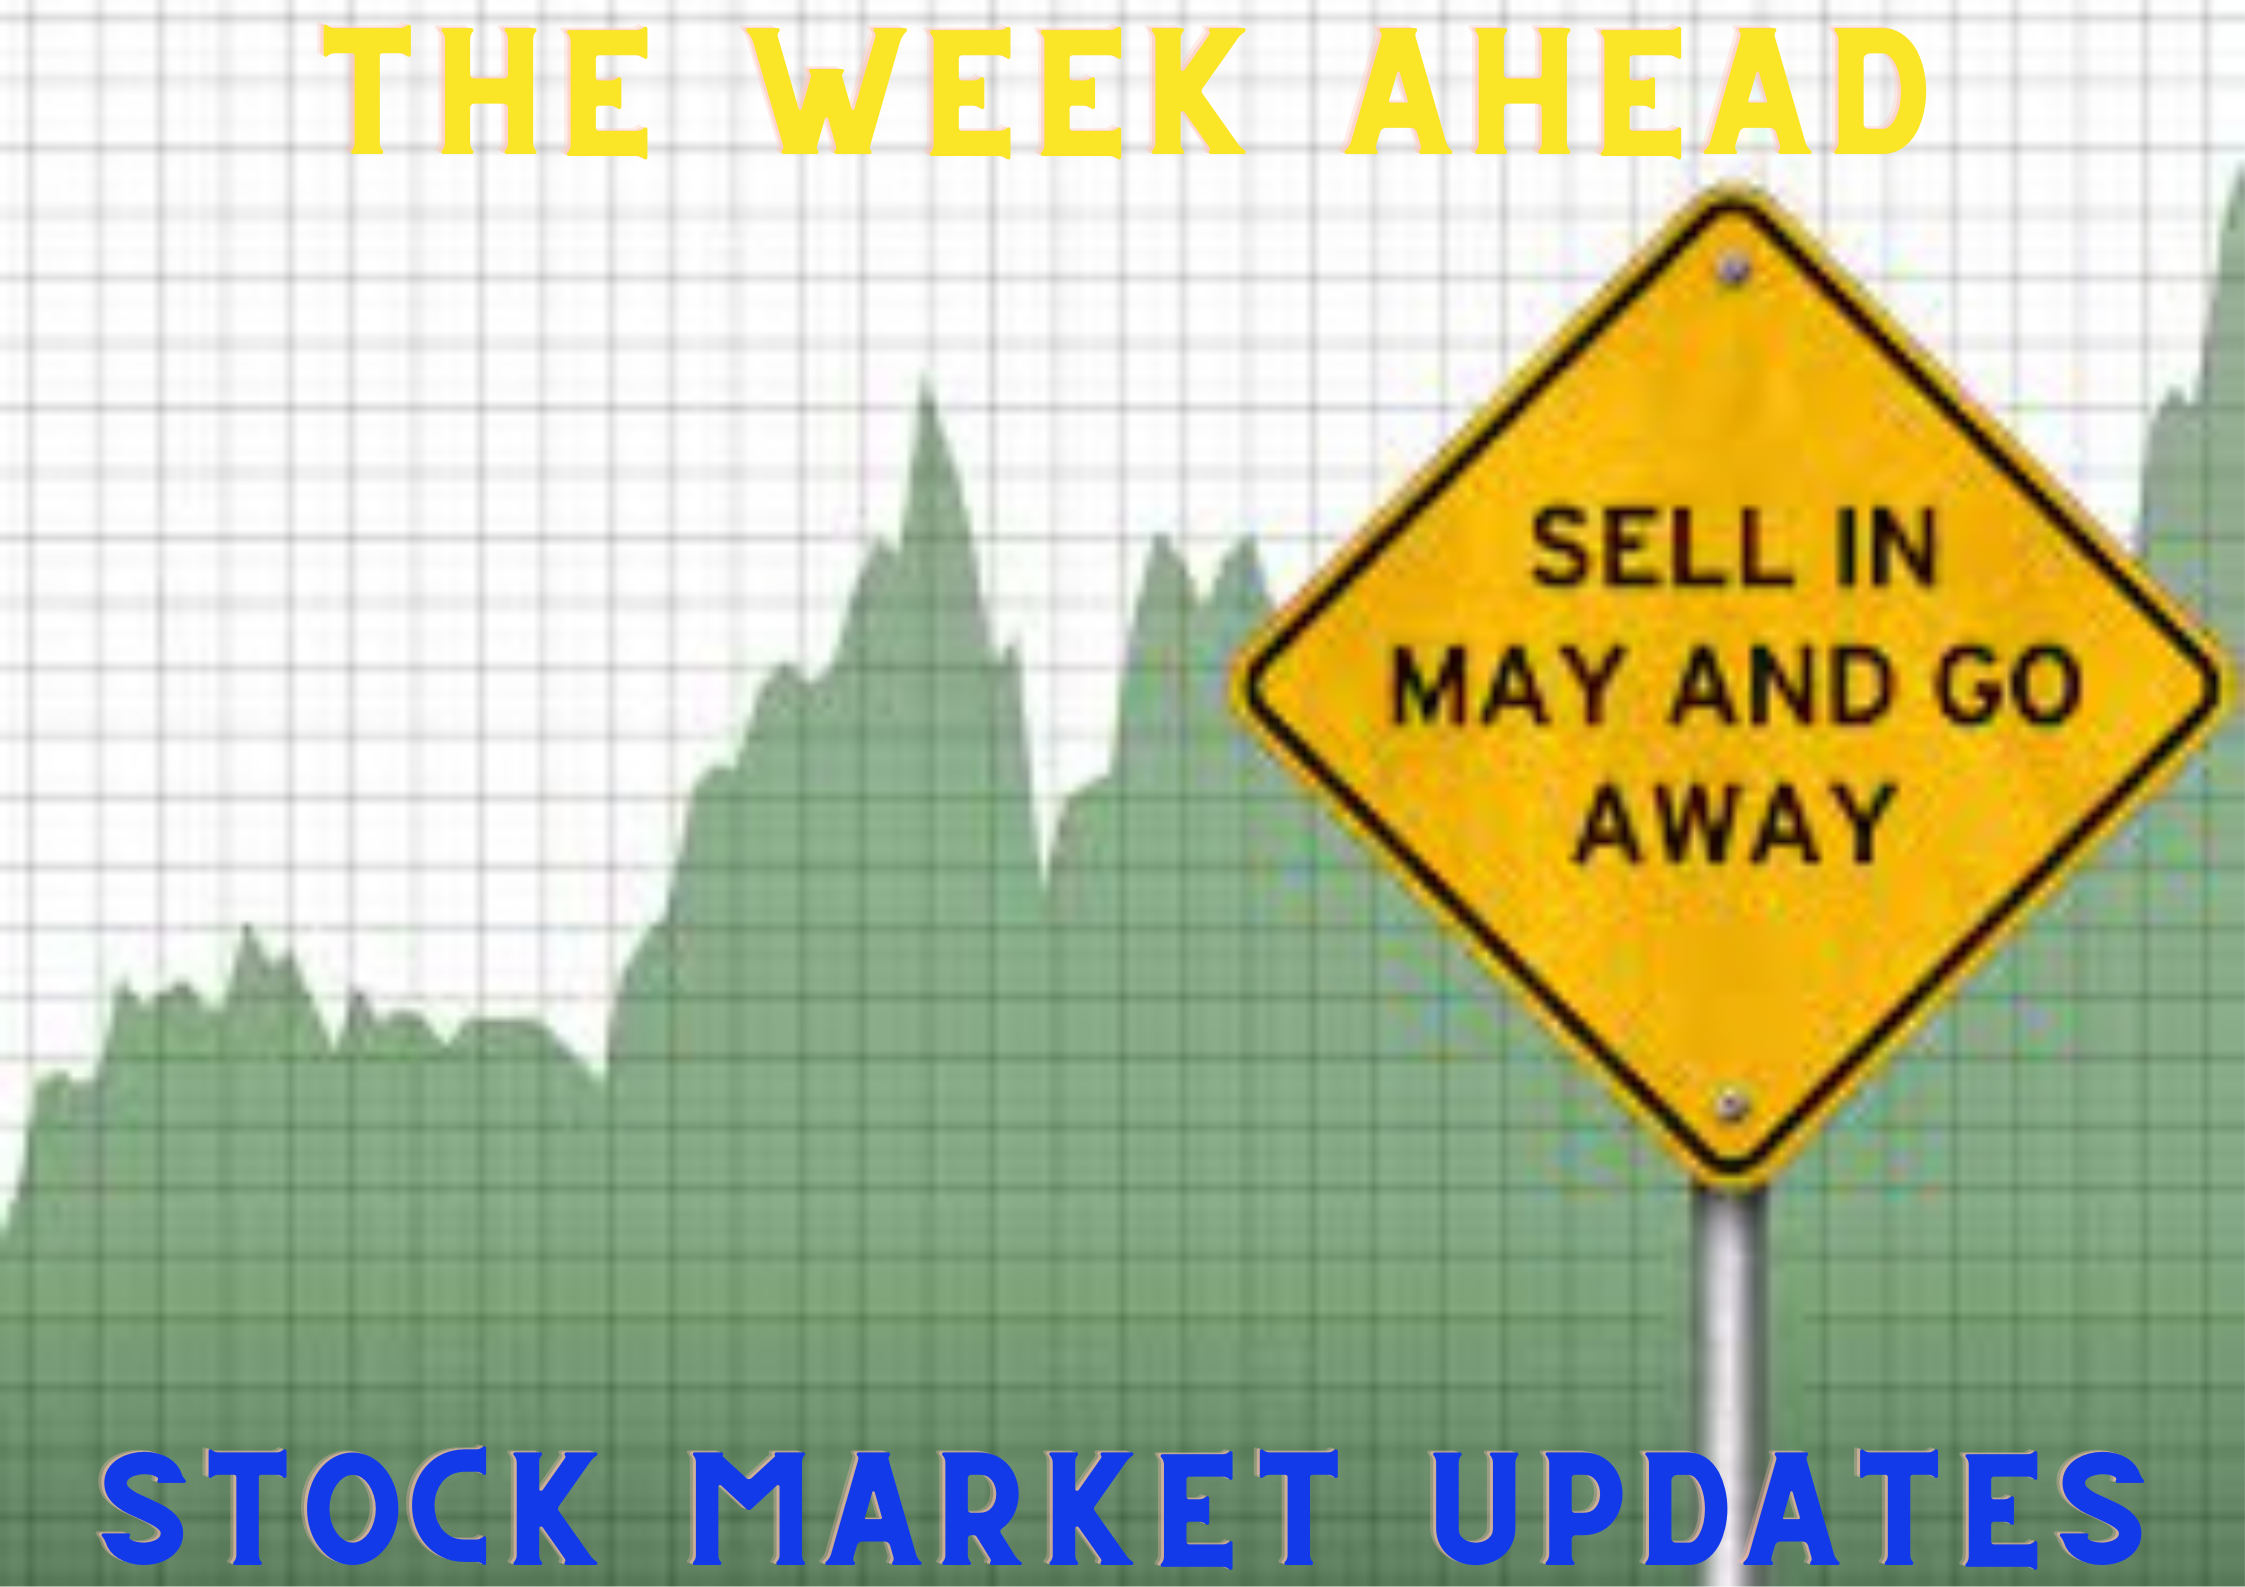
Secondly, the famous saying sell and go away in may! Will this self fulfilling prophecy happen?
Taking a quick look for the past 10 years S&P 500 was up 90% of the time but if we were to look back from 2008-2013, S&P500 actually fell 4/5 times or 80%. As such sell and go away in May ending in a negative region was about 33% for the past 15 years.
So for May, selling and going away in May might not hold true. The upside could surprise also depending on what Fed says.
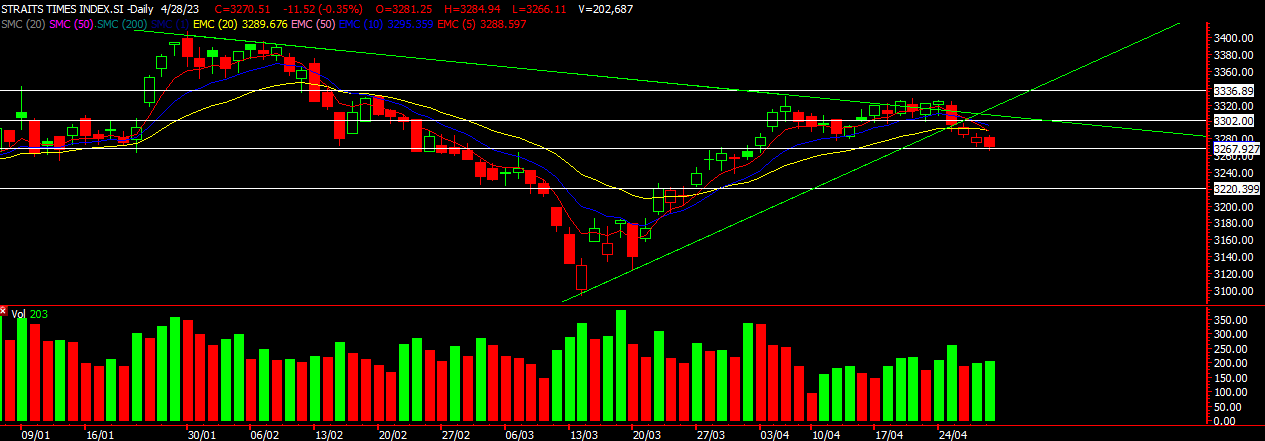
STI
Chart source: DZH International Advisor 1st May 2023
The moving averages are sloping down for the STI with the 5ema acting as the resistance. For this week we might see more downside for the index. It might try to move up test around 3295 and head back down. A break of 3267 could see it pullback to 3220. At that level, we probably see more entry as the index would look more attractive then. Banks are the main driver and we are seeing weakness in it that could drive the index down. Individual stocks are actually fairing pretty well despite the negative sentiments.
HSI
Chart source: DZH International Advisor 1st May 2023
HSI a little different from STI. We might see more upside for the week. The 20ema acted as the resistance which could see a bit of pullback first before accelerating upwards. We could wee about 20500-20600 for the end of the week as HSI is starting to form a base.
Head over to our Facebook to find out more about view on the US markets.
Yours
Humbly
Kelwin & Roy


