Market Outlook for New Year 2017 – Oil and Oil stocks

12th January, 2017, 9:56 PM

Market Outlook for New Year 2017  – Oil and Oil stocks

The Market for Year 2016 was a pretty volatile year with lots of bullish surprises, January 2016 many markets started badly with US oil dived into 13- year lows of $26.15 before rallied more than double to $53 at 2016 close, helped by the November Opec agreements to cut oil output since 2008, which also caused many oil and gas related stocks to rally from their lows in 2016.

As 2016 progressed, the 2 potentially black swans events (Brexit and Usa Elections) turn into “white” swans effect instead, with the unexpected Brexit rally and the ”Trump rally “ powering the Dow jones to new highs after Donald Trump unexpectedly got elected .

Will Oil & Oil Stocks rebound continue in 2017?

This will largely depend on 2 main factors; First is Opec members and its allies (e.g  the Russians) need to adhere to the oil supply cut agreement they had in November.  Saudi, the Opec leader seems to be leading by example in implementing the oil production cuts.

Click on the news article by marketwatch dated 5 January 2017 for more details.

Secondly is how the return of the USA shale oil players, given the oil rise for past few months will impact the supply of oil in the market.  If oil can maintain a price range of between $40-$60, this could provide support for the oil stocks.

With that, let’s look at 2 big oil stocks for New Year 2017: Keppel Corp and Sembcorp Marine
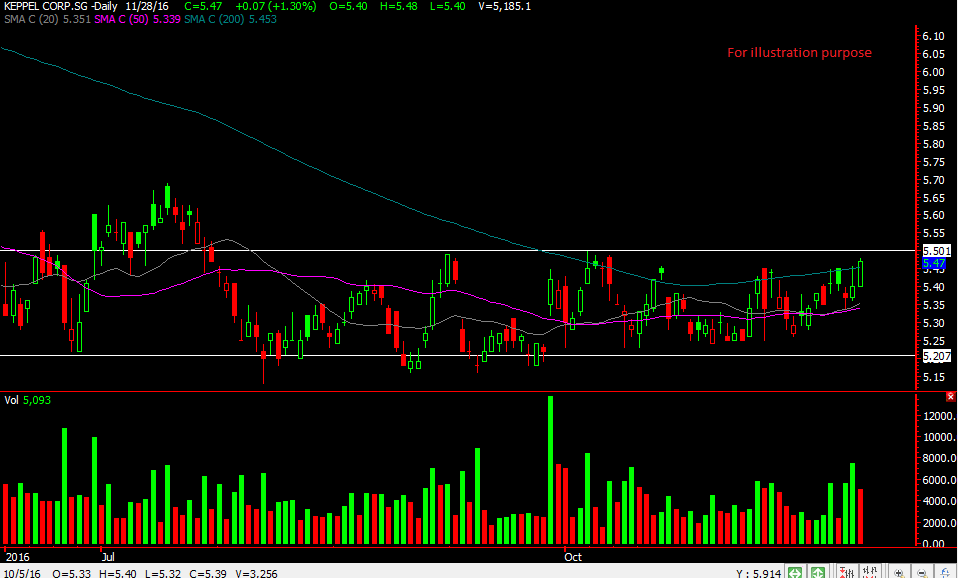
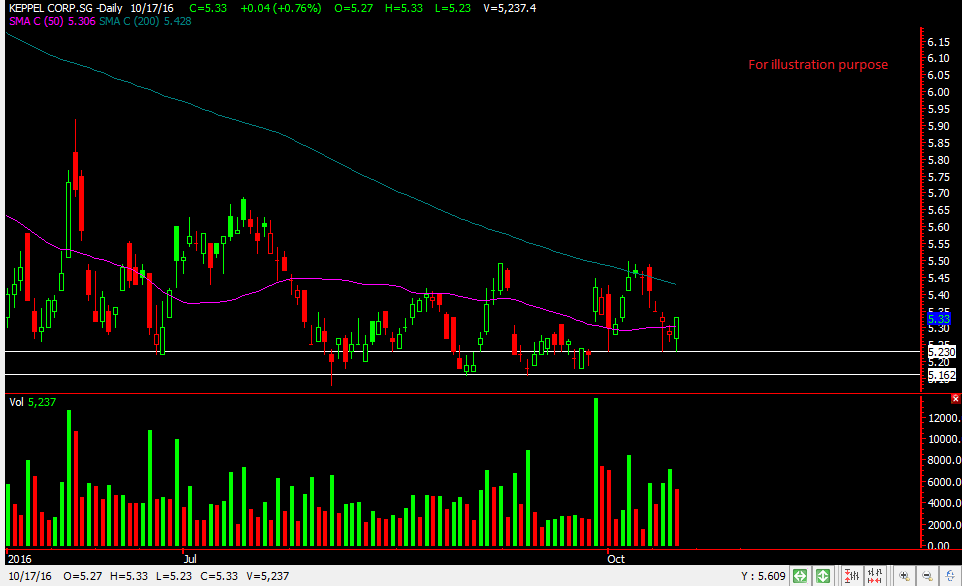
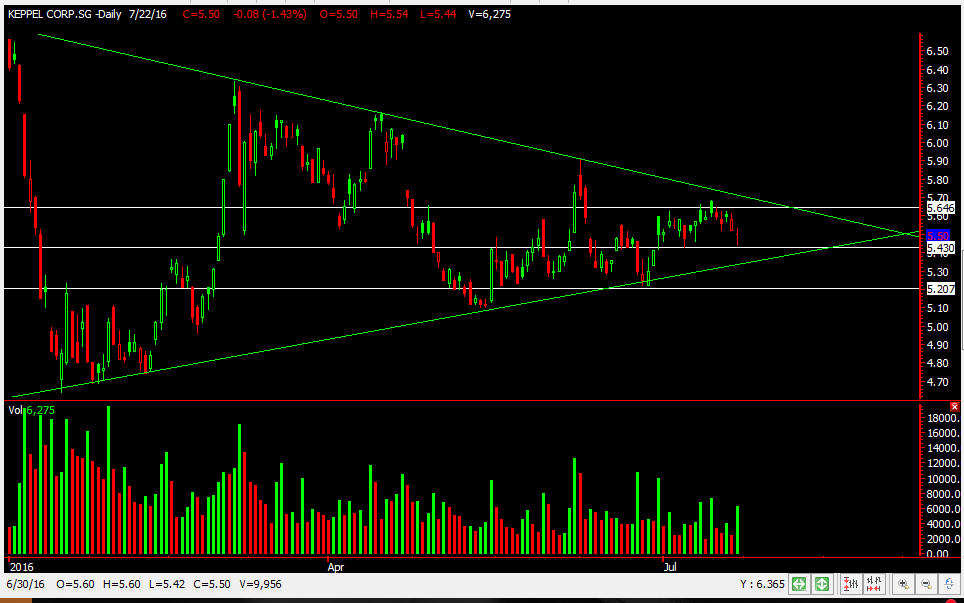
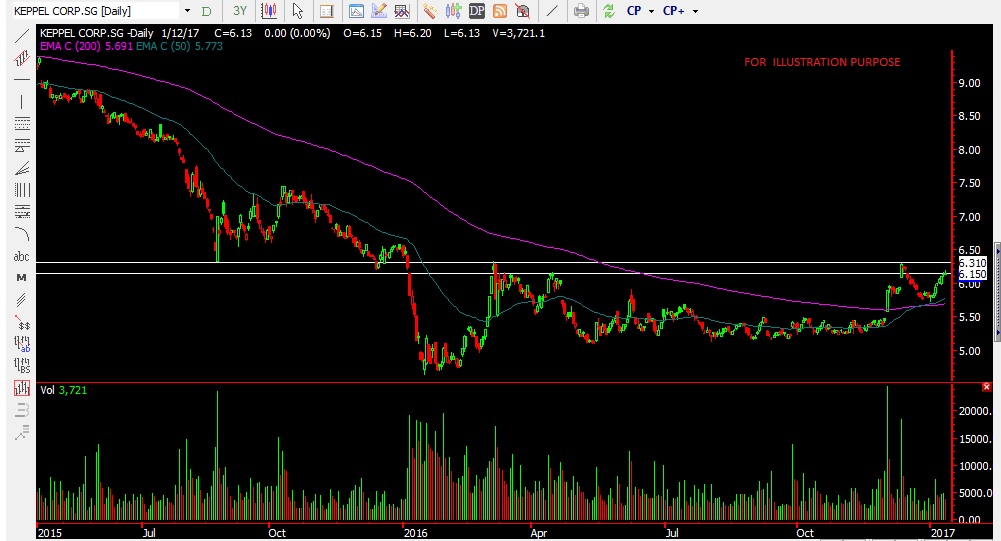
Keppel Corp

Keppel Corp rallied about 25% from its Jan 2016 low $4.64 to its 2016 closing price of $5.79.  The Stock is now above its mid-term 50 day moving average and long term 200 day moving average, which may suggest the stock may be on a uptrend having rally from the bottom formed last year.

It is currently slightly below its horizontal resistance of $6.15, with $6.31 as the next strong resistance, which the stock needs to break above to have further upside in the mid-term.
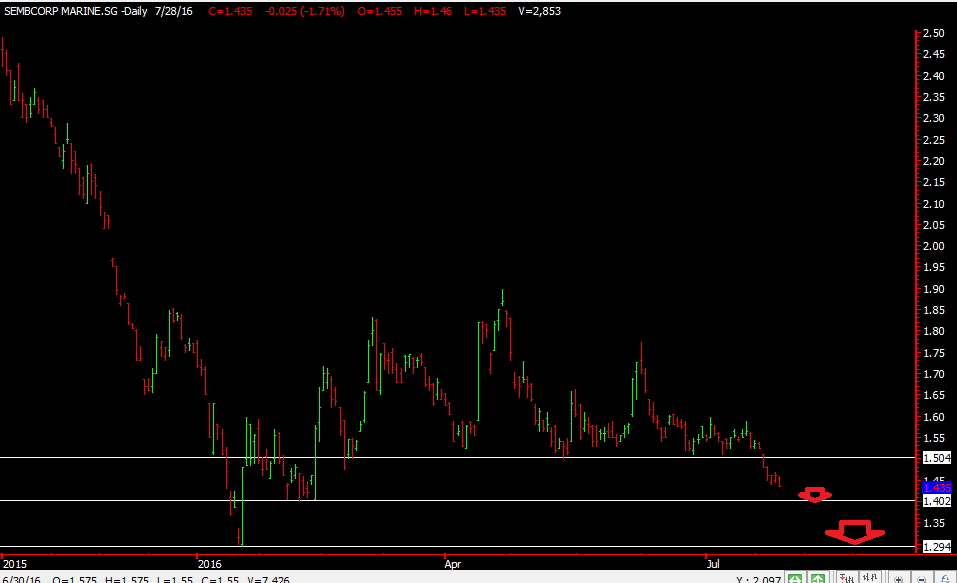
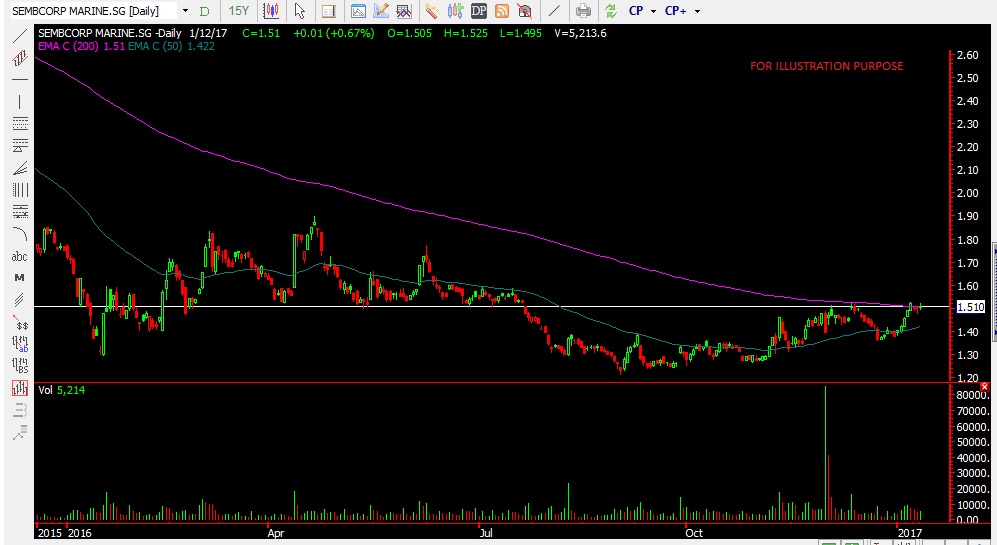
Keppel corp 12 jan 2017


Semb Corp Marine

Sembcorp Marine rallied about 13.5% from Its September 2016 low of $1.215 to its 2016 closing price of $1.38. The Stock is above its mid-term 50 day moving average and is now at its long term 200 day moving average of $1.51 which is also its horizontal resistance.

If it can break and maintain above this $1.51 level, this may signal more upside for the stock in the midterm.

Sembcorp Marine 12 jan 2017


Ok folks that’s all on Market Outlook for New Year 2017 for now.

If you have any questions on other stocks/ sectors and would like to seek our views, feel free to click “Contact Us” in the blog and we will try to revert back to you as soon as we can.

If you like to receive timely trading ideas via your hand phone from us , simply open a poems trading account with us by filling in the  “Contact Us” section in the blog to contact us for more details .

Yours
Humbly
Kelwin & Roy .

Keppel Corp

28th November, 2016, 1:52 AM
Keppel Corp Nov 2016

Over the weekend there was some stir in the oil price as Saudi wanted to leave the talks. Oil took a tumble and one might be expecting our oil counters to fall too. But instead our oil counters held and keppel corp is currently above the 200ma . Opec meeting starts on 30th nov so we’re keeping an eye on that to.

We’re looking for it to clear the horizontal resistance line at 5.50 before considering an entry. Our stop loss would be 5.39.


Yours

Humbly

Updates : Sembcorp, Sembmar, Keppel Corp

28th July, 2016, 1:24 PM

Sembcorp ever since our previous post on 24th jul has been coming down and finally close at 2.85 today. We’re hoping it test then 2.8 support then head to 2.6. Still looking bearish for us.

Sembcorp Marine Jul 2016

Sembmar ( SMM for short) since last friday as it broke the 150 support started to come off and down to 1.435 today. It reported its result this evening (http://www.sembmarine.com/scm2016/wp-content/uploads/2016/07/SCM2Q2016-PressRelease-28July2016-1.pdf) . Results wasn’t fantastic Q2 profits down 90% from the same period a year ago. We’re looking at 1.40 then 1.30 eventually.

Keppel Corp also down from when we posted, though alittle late but better late than never right? On track for 5.20 target

Yours

Humbly


Keppel Corp

24th July, 2016, 1:12 PM
Keppel Corp July 2016

Keppel Corp posted 2Q 2016 Net Profit down 48% to S$205 million, compared to S$397 million for 2Q 2015 just last week which sent the stock down. Some support seen at 5.42 area and if that  doesn’t hold then it come down to 5.35 then 5.20. We are looking at more downside for keppel corp

Yours

Humbly


Keppel Corp

16th June, 2016, 4:13 PM
Keppel Corp June 2016

Also similar to sembcorp, there was an increase in vol today and its also near is uptrend line and horizontal support line. If we were to short we should short either at when it breaks 5.25 or if you want abit more confirmation then perhaps when it breaks 5.20 . Stop loss will be 5.38 or 5.26 accordingly.

Hey, do look at china Aviation , there might be a chance to for short if it breaks the horizontal support of 1.145. Stop loss at 1.23

SGX is another  one, if it breaks it horizontal support of 7.42. Stop loss at 7.52. Don’t have time to post the chart so do look at the charts first ya.

Time for bed =)

Yours

Humbly


Keppel Corp

2nd April, 2016, 3:13 PM
Keppel Corp Apr 2016

Oil tried to stage a rebound to about $41 in the recent weeks  but couldn’t stage a strong enough rebound to go past that and profit taking is taking place.

Keppel corp or KC for short is a stock that is related to the oil industry and is at its immediate support and a break of the horizontal support of $5.77 might see it touch that short term uptrend line and a further break might see it finally down to $5.50 . Our Stop loss if we short would be at $6.

Yours

Humbly