STI

23rd June, 2016, 12:09 PM
STI June 2016
STI June 2016

With all eyes on brexit, just an update on STI, if britain were to stay we might see STI moving up to 2845 area which then might be resisted. Around there we might have to wait and watch to see what happens then. If market continues to be strong then don’t short yet and follow the trend.

If britain exits then we might see more downside tomorrow to about 2722 level..

Yours

Humbly

STI

14th June, 2016, 3:18 PM
STI June 2016
STI June 2016

It was an interesting day today, STI opened up looking promising and even turning positive at one point and we were watching closely to see if it can stay above the uptrend line. Hours past and finally it couldn’t hold and gave up whatever gains and closed down 17 points. It is currently below the uptrend line and with that we might see more downside to 2700. A stop loss would be at 2800 because if it crosses above that it might start to cover the gap.

Bank stocks might be worth taking a look for short too, OCBC , DBS are some of our candidates. Do do your own diligence too ya. We updates on the banks shortly

Your

Humbly


Update on STI

20th February, 2016, 8:03 AM

STI

Rally was strong over the week and many have asked what to do and if its time to short.

Well, just to share our thought and the roadmap for STI.

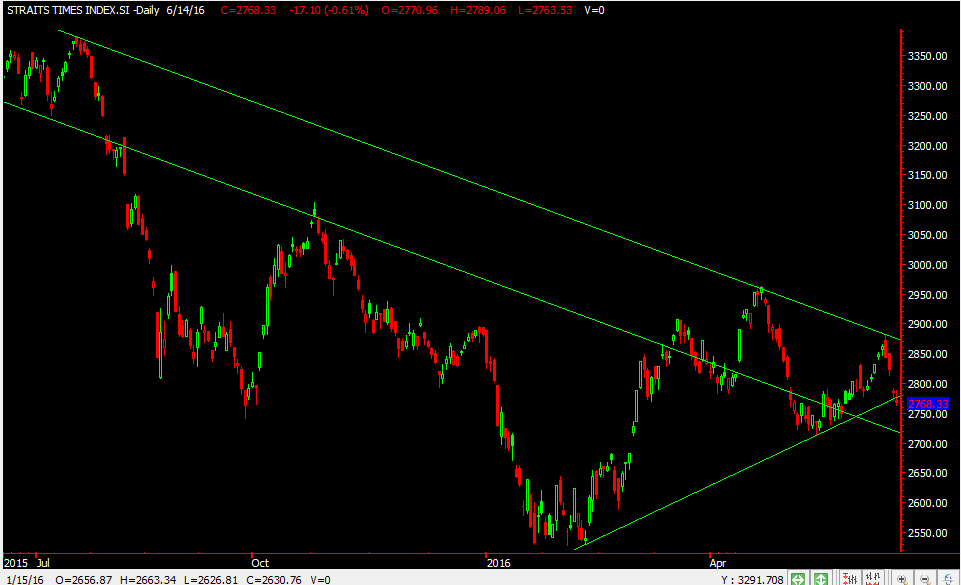
STI currently at 2663 and it seems possible that STI might break above it in the coming days and even test that downtrend line at about 2700 levels. From there we should watch closely to see if it can continue to break to test the resistance levels of 2758 then 2800 . We are not turning bullish but if you like to trade the rebound then maybe just watch those levels. We are waiting to see those levels to plant shorts and will cut if we’re wrong. Our stop loss will be above those resistance lines if we short so that we minimize our loss.

Remember to always have a plan and not trade blindly.


Yours

Humbly

STI

3rd February, 2016, 3:35 PM


STI Feb 2016
STI Feb 2016


Our STI is currently being supported by the horizontal support at 2528 aea which we can see was also the low of 21st jan this year and if we scroll back the low in oct 2011. From the chart we can see its range bound for now between 2528- 2631. But , if this support of 2528 area breaks we might see more downside and if that happens are you ready for more downside? We are! and we hope that you are too! Are you ready to embrace the downside or will you be looking to catch the falling knife and get hurt during the process. Learning how to short this year might be one of the best things to learn this year =)

We are looking to short if STI breaks 2528 with a stop loss of 2530-2535 as a tight stop loss. Blessed day

Yours

Humbly

STI

21st September, 2015, 3:26 PM

Just an update on the STI, the last we saw it hit the low of 2837 when it broke our horizontal line of 2877 it didn’t hit our target of 2808 level missing it about 30 points.

With that it seems that STI looks strong but for the moment is in a sideway consolidation mode. Its friday’s closing was below the downtrend line and it seems that we might be testing that first downtrend line again. A break above that might see STI test 2928 level in the coming days. So stay alert. Its an upwards bias from here.

STI Sept 2015
STI Sept 2015

Yours

Humbly

STI

5th September, 2015, 7:56 AM

The STI broke it’s immediate support of 2877 on friday and saw selling throughout the day. With Dow closing lower on friday night we might expect the STI to move down and retest the previous support of 2808 level and if a break of that we might even see it go lower to test 2756 area and depending how bad the markets might be we will then update then again.

STI Sept 2015
STI Sept 2015

Yours Humbly