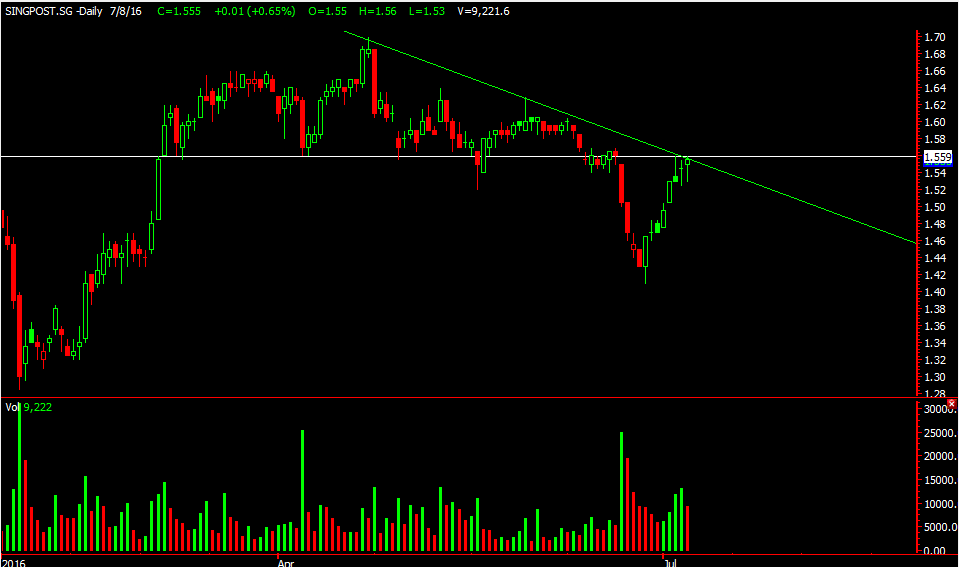
Singpost, we sent out an alert for singpost end june informing our clients about support and potential upside since 1.475. It has risen to 1.56 ever since. With that it is now hitting the downtrendline and the horizontal resistance. The closing candle on friday was a nice recovery candle so now lets wait and hope that it breaks that 1.56 level. Our stop loss would be at 1.515.
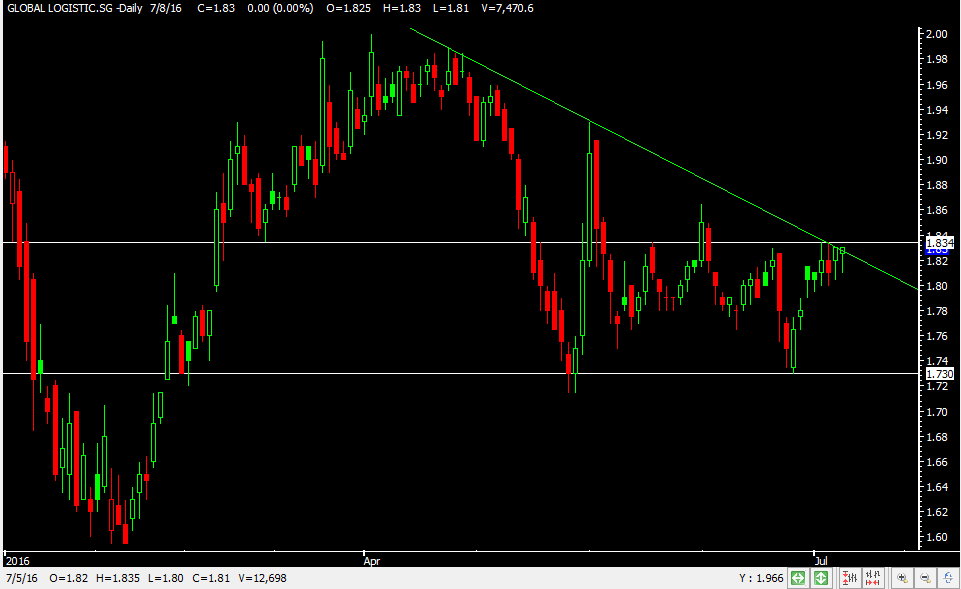
GLP has been hugging the downtrend line and the horizontal resistance line. A break of 1.835 might see it move higher to 1.865 then 1.88. Market seems bullish so lets wait and see if GLP manages to break up from this resistance. Stop loss would be 1.80
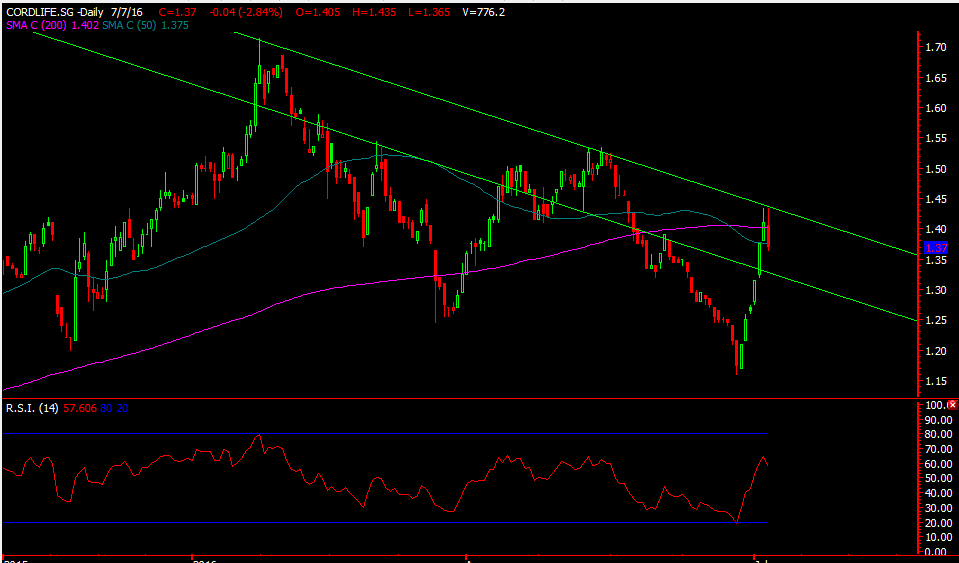
With a new born in the family this stock is interesting to us =)
It is wedged between the 200 and 50ma now. The 200ma acts as the first resistance then the downtrend line that we see. We are bullish on this stock and if the support holds at1.37 or 1.32 we might consider an entry there. =)
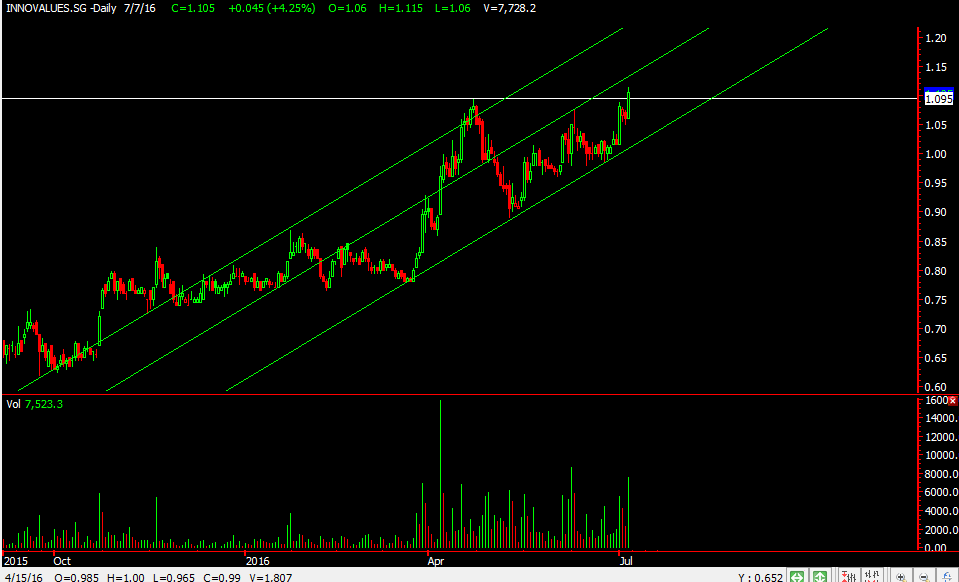
Innovalues has broken and stayed above its horizontal resistance of 1.095 which we message to our clients about the breakout . It went to a high of 1.115 ( all time high) and might be meeting some resistance on the middle uptrend band. IF that breaks we might see it test about 1.20 level. Stop loss would be 1.085 and 1.045.
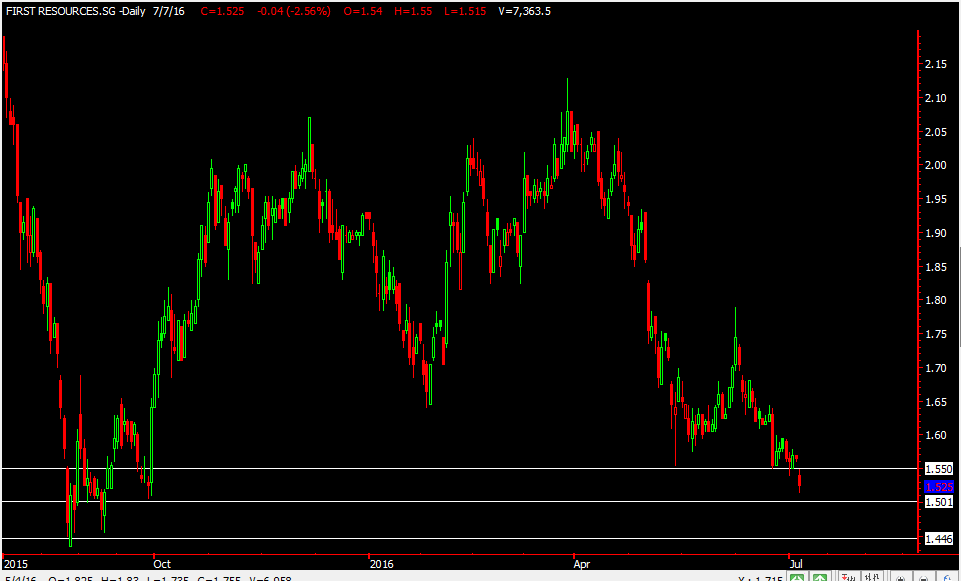
If you been following us you would know that we been fairly bearish on first Res. The market for the past week has been moving up but we noticed first res hasn’t been moving much but in fact it came down and today it broke its recent support of 1.55 and its below that now. It might come down to 1.50 and it that still don’t hold then 1.45 will be the next target. Our stop loss would be 1.56 or 1.60
Hope everyone had a good weekend and are ready for the short week ahead. We had some time to reflect over the weekend and we’ll like to share some thoughts.
Firstly, following the trend, as most would know , the trend is your friend, follow it don’t go against it. If you think like us after brexit that the market would come down but it didn’t then we might have to change our plan and follow the trend. Yup, from our blog you would sense that we were hoping for more downside. We were wrong on that and now the question is, how do we fight back. ( We fought back on singpost, jumbo and acromec) and hopefully our clients did too
Secondly, your stop loss, well, trade will go against us from time to time. When that happens, don’t hope for the best but do what is right and cut loss at your determined level, don’t keep telling yourself it will be better. Cut loss first, take a step back and then u will be calm. NEVER go into a trade without a trade plan and as the saying goes and as cliche as it may sound, IF you fail to plan, you plan to fail.
Lastly, don’t even try to take revenge ,as we all know that usually leads to much disaster. In fact, continue to plan your trade accordingly, keep calm and don’t go crazy.
We’re just sharing our humble thoughts in which we hope we will be better traders after this =)
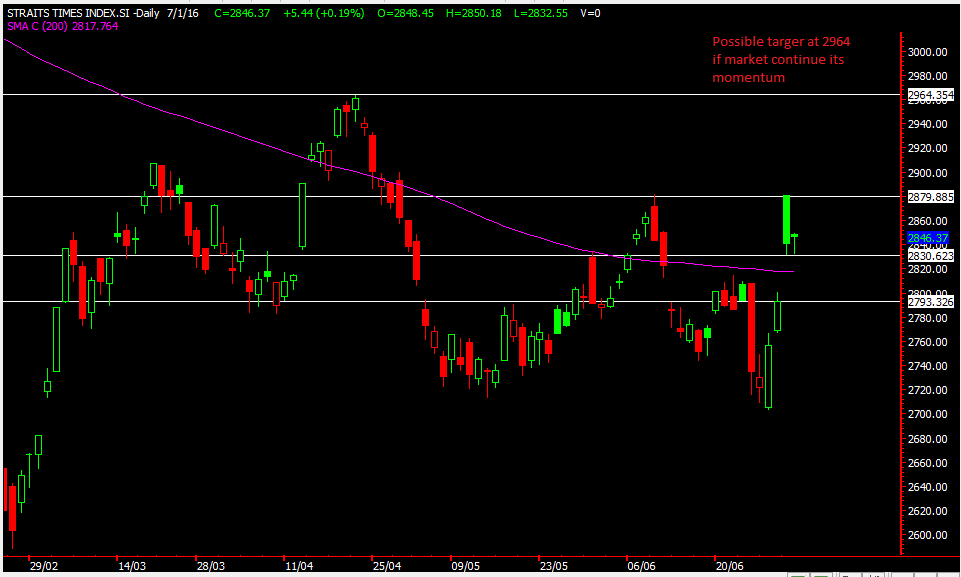
We have attached the chart of STI , currently we can see its above the 200ma which is significant. Next resistance at 2880 and if that breaks we could eventually see 2960 in sight. Support is at 2830, then the 200ma and if that don’t hold then we might start to see it cover the gap to 2793. Lets respond to the market accordingly and we’ll update accordingly
Crazy news!! The STI is just 7 points away from friday’s high when brexit was announced. It as if Brexit didn’t happen and all it took was just two days for the market to recover back to where it started. Amazing? Crazy? Well, welcome to the stock market, where anything goes and rational thoughts goes out the window.
It might see irrational that market can just recover so fast and you might be lost by now. Well, we too have been stunned by the recovery but as we mentioned before please ensure that your stop loss is in place. We can’t and won’t get every direction right that’s why we need our stop loss in place for moments like this.
So stay calm and lets see what the chart says now
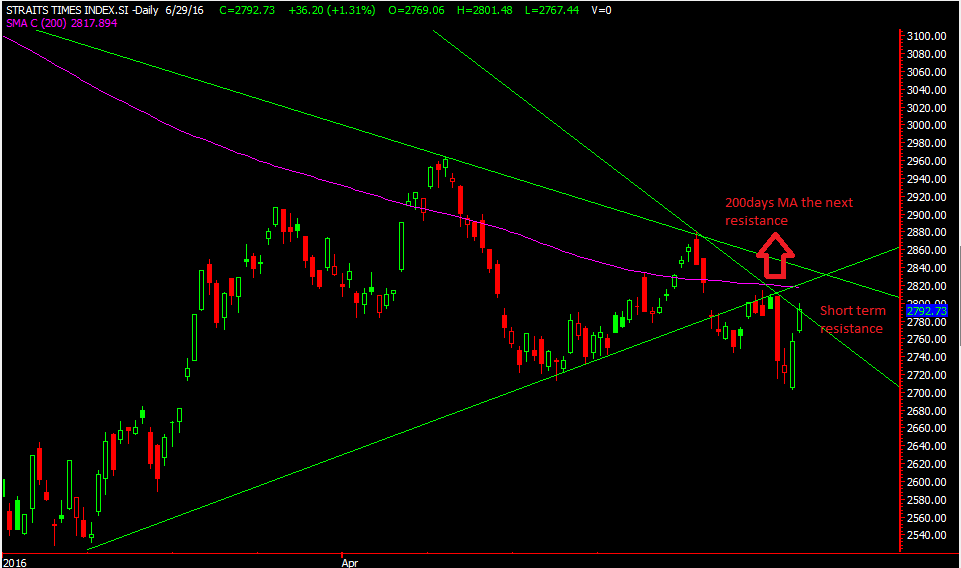
STI june 2016
As we can see, the short term downtrend was touched and pulled back after that, the next one to look out for would be the 200ma at 2817 then finally if that holds then 2837. These are some of the resistance points we are looking at. IF the index shows weakness at these areas we might look for shorting opportunities.
In the aftermath of Brexit , Gold has hit a new 2 year high of 13oos as we speak. Beside trading spot gold which involve margin and risk of margin call , exchange traded funds ( Etfs) are another asset class we can look to invest ( for buy and hold) to benefit from the rising gold price. SPDR Gold Share (GLD) and VanEck Vectors Gold Miners ETF (GDX) are 2 such etfs which we can look at .
SPDR Gold Share (Ticker Symbol: GLD)
GLD June 2016GLD detail June 2016
This Etf seeks to reflect the performance of spot gold price. It is both listed on SGX and NYSEArca in USA . Both image refers to the GLD listed on SGX. In the first image , Since 10 February this year , when GLD broke above its well define downtrend line which was in place since 2013 , it has not look back and has been on a uptrend since then.
In the Second image , GLD has been in a well define uptrend since January this year , if it pullback to the uptrend lower channel support line the next time around US$119 level, it may present a good risk reward entry level .
VanEck Vectors Gold Miners ETF (Ticker Symbol : GDX)
VANECK VECTORS GOLD MINERS ETF June 2016VANECK VECTORS GOLD MINERS ETF detail June 2016
VanEck Vectors Gold Miners Etfs (GDX) seeks to replicate the price performance of NYSE Arcra Gold Miners Index . It is listed on NYSEArca in USA . When Spot Gold rises , it tends to positively impact the share prices of Gold Miners in general . Hence this Etf is a good proxy to the price of Spot gold . In the first image , Since February this year , GDX has broken above its well define downtrend line which was in place since 2011 , and been on a uptrend since then.
In the Second image , GDX has been in a well define uptrend since late January this year , if it pullback to the uptrend lower channel support line the next time around US$24-US$25 level, it may present a good risk reward entry level .
Well, yes its true, UK voted out of the EU and the whole world is in shock. What will happen next?
Some concerns would be currency wars as the pound and euro slides will other countries have to devalue their currency in order to stay competitive too? How will companies with exposure to UK be affected as now they have a weaker pound to deal with. Companies with earnings in pounds might take a hit we suppose.
So is this a time to go in to scoop up some stocks or do we wait and see or do we go short? With some saying market has priced in the exit on friday. Lets looks at some charts before we decide. Remember we’re just sharing our humble views only ya. =)
STI
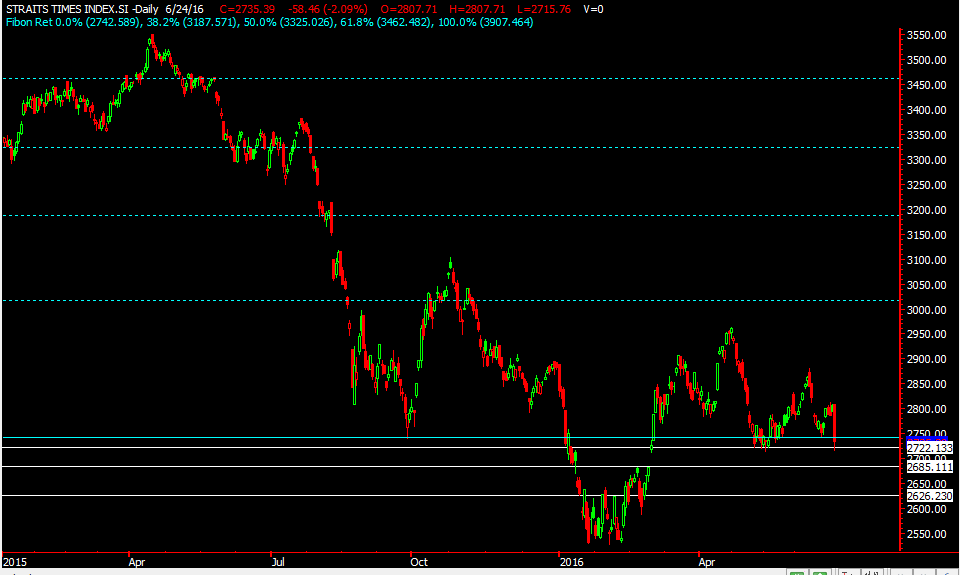
STI Jun 2016
from the previous update, if there was a vote to remain we could see an upside but that did not happen but the vote was to leave and we saw how STI plunged to our support area of 2722. Well, if the support of that breaks then we could see STI covering gap to 2683 and if that don’t hold then 2630. It seems to us that downside might be more likely given how violently the market reacted and it was a shock to the markets as most were pricing in a stay. Till now, it seems unsure of the real implication and people are trying to make sense of whats happening. Rebound could happen but we are looking to short on rebound meaning to say short at resistance after a rebound or short when it breaks down .
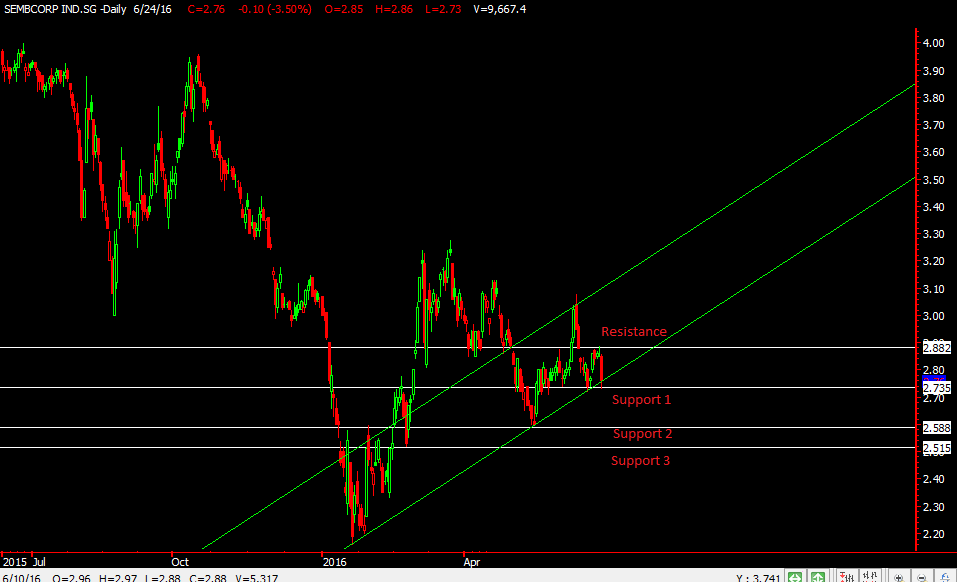
Sembcorp
Sembcorp Industry June 2016
Still quite resilient being supported by the uptrend line and horizontal support, a break of 2.73 would be a short for us and the support levels as our target downside.
Sembmar on the other hand, is a weaker stock, and 1.505 is the support, a break of that might take it down to 1.40. Remember your stop loss too which we will place at 1.60
Do refer back to the chart of capitaland which we posted on 14june, the support finally broke and it slammed down to a low 2.87 on friday. Remember we only short when it breaks the support unless you are willing to take more risk on short on anticipation .
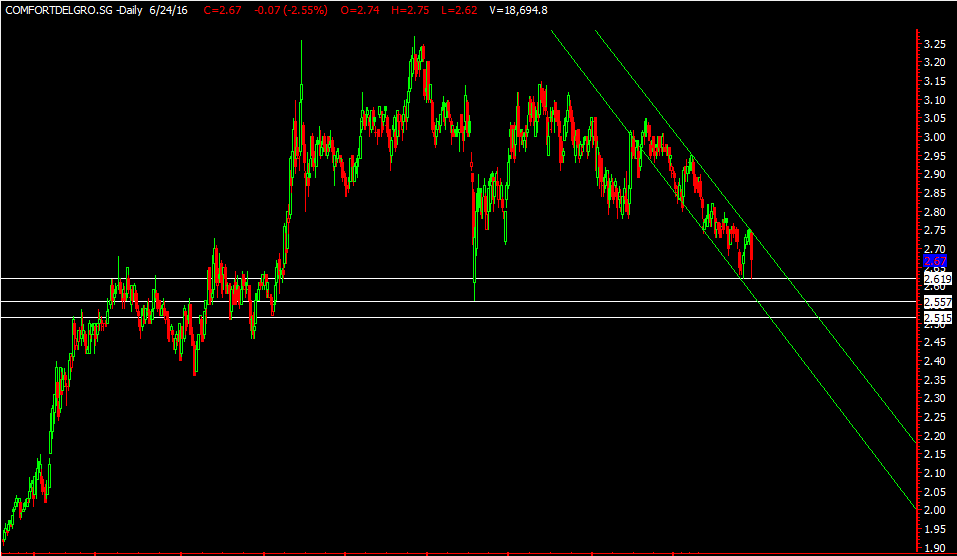
Comfort Del
Comfort Del June 2016
Comfort delgro having exposure in UK and due to the fall in the pound, its revenue might take a hit too, on friday people were selling comfort del, but it hit a support of 2.62 and had some rebound, if it breaks the 2.62 downside might be to 2.55 then 2.51. Remember your stop loss
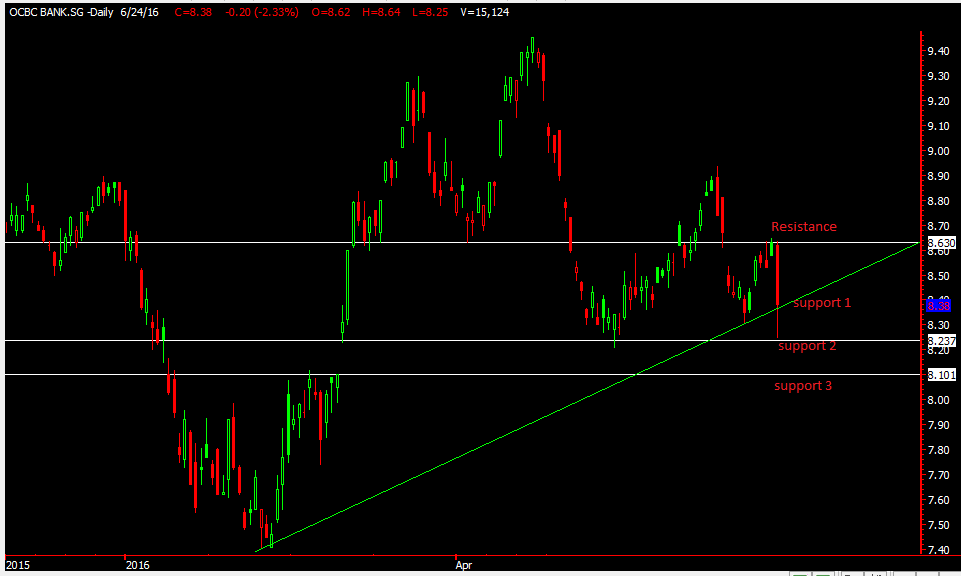
OCBC June 2016
OCBC
Local banks also took a hit as they also do have some exposure to the pounds. We are looking at those support levels.
There are alot more charts to share but of course with limited time and space we will stop here for now.
Some points on trading this week, remember to HAVE a stop loss whenever you are trading. Market could rebound since it dropped quite a bit during the week.
We prefer to wait for stocks to break support then short or touch hit resistance then short .
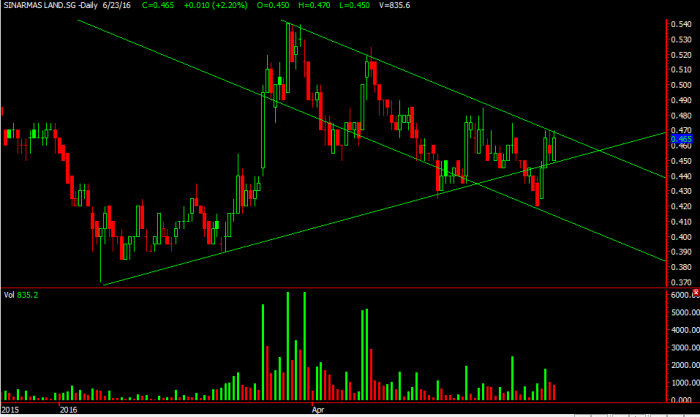
We’re watching this stock called sinamars land and recently it released some news on its website
SOUTH TANGERANG, KOMPAS.com – Sinarmas Land officially announced the development of the Digital Hub area in southern BSD Green Office Park City, South Tangerang. –
It is currently testing the uptrend line of 0.47 and a break above that might see more upside to 0.49. It could consolidate to the end of the wedge so do that note of that see where it might potentially go .
Yours
Humbly
Follow and like us:
ACT NOW and Be Part Of Our Trading Community
Open a Trading Account with us &
Receive our Top Tier Remisiers trading analysis to your handphone
& Trade the market with Simplicity and Conviction! Act Now!