Lion-OCBC Securities Hang Seng TECH ETF – [Is A Bottom Forming? ]

9th March, 2021, 2:40 PM

Lion-OCBC Securities Hang Seng TECH ETF – [Is A Bottom Forming? ]Lion-OCBC Securities Hang Seng TECH ETF 9th March 2021

Chart Source: Poemsview 9th March 2021

The Lion-OCBC Securities Hang Seng TECH ETF listed on the SGX comprises of the 30 largest Tech- themed companies listed in Hong Kong. Companies like Alibaba, Tencent, Xiaomi, Meituan Dianping, Jd.com are just some names inside this ETF.  A common saying that the HSI tech index is the China’s Nasdaq index is not very accurate as it only tracks companies listed in Hong Kong but there are other tech companies listed in Shanghai and shenzhen exchange. The Chinext or Star Market is probably more accurate as it tracks the broader China tech market.

As many have asked if this is a good time to start entering if you want some exposure to the HK tech stocks and are not sure which company to enter into. Rather than choosing which company to invest in, this ETF gives a good exposure to the HK tech companies. Instead of tracking so many companies this ETF tracks the 30 companies which might save you some time and effort in your research.  There are a few HSI Tech ETF that are listed like on the HongKong Exchange like 3033.hk, 3067.hk. 3088.hk but we’re looking at the one listed on SGX which is closer to home which means we don’t have to pay custody fees too. Another point is the currency exchange risk. So for simplicity sake we’re looking at Lion-OCBC Securities Hang Seng TECH ETF.

Lets looks at the chart of this ETF an as we can see from the chart is it kind of forming a double bottom of around $1.32 level. If it can maintain at around this support and start consolidating around here thats a positive sign to us. It has retraced close to 30% since the high of $1.83 and at this level it does look attractive for a long term play. As usual, don’t scale in all your entry at one shot, go in in different batches. Now that it has reached a nice support, of around $1.31 , the next support might be around the $1.25 then $1.20 area. The short term resistance is at the 5ema and the downtrend line.

Remember that investments carries risk so do remember to do your own due diligence and risk management.

Are you bullish in the future of the HK tech stocks? What are your thoughts? Share them with us.

Yours

Humbly

Kelwin&Roy
AEM – Is A Rebound Insight? When Will The Selling End?

9th March, 2021, 7:27 AM

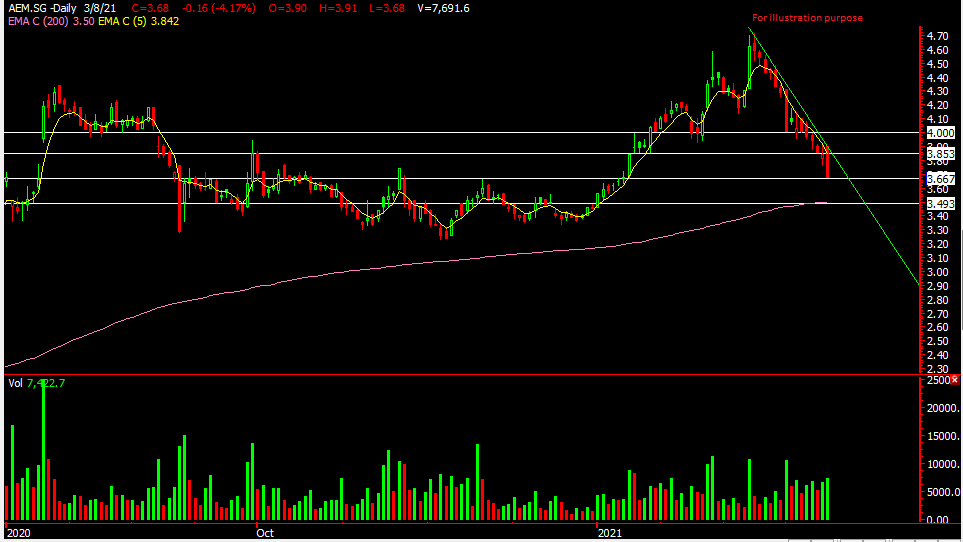
AEM – Is A Rebound Insight? When Will The Selling End? AEM 9th March 2021

Chart Source: Poemsview 9th March 2021

AEM has recently been sold down over 20% when funds started to shift out to more value stocks. Despite research reports maintaining a buy on AEM, AEM continues to sell down causing investors to think twice about touching it.

Lets look a little closer at AEM and its recent results. Its FY20 revenue/net profit was in line with consensus. Balance sheet remains in a net cash position. It announced another acquisition to strengthen its system level test capabilities.

And now lets take a look at the technical chart. AEM has corrected about 20% sine the peak. A horizontal support of around $3.66 might provide some support and our next support might be around the 200ema of around $3.50. A rebound might be in sight after such a fall as bargain hunters are on the lookout at current price. A nimble bite at this current price is what some investors might consider doing. As for traders, we’re looking for a bullish candle off the support level or even a break above the 5ema (highlighted by the yellow line) before an entry. As we can see, the 5ema as been acting as the resistance and so far AEM cannot break through that.

What are your thoughts? Will AEM continue to fall even more? Lets us know!

Yours

Humbly

Kelwin&Roy

Nasdaq In Correction Territory, What To Do Now? Our Game Plan

7th March, 2021, 9:48 PM

Nasdaq In Correction Territory, What To Do Now? Our Game PlanNasdaq 7th March 2021

Chart Source: Poemsview 7th March 2021

The past two weeks probably wasn’t the best for traders who went long as market globally started to pullback. The Nasdaq pullback to correction territory down about 12% since the peak. A correction territory is usually defined as a 10-15% pullback. How far more and how long would this correction last? No one can really tell, but we can shed some light and share some our plans during this time.

Markets came off probably due to some reason like the 10 year yield moving up, and for why Nasdaq came off more than the overall market? It could be funds switching out to more cyclical stocks as the economy improves with an the covid vaccine being rolled out. With the sell down, traders who were over leverage probably got hit and were being forced to close off their positions, algo trading, shortist also joined in the party which made the drop even faster.

So what should we do? Well, it depends on what you are?  A trader or an investor? Don’t get these two terms confused. If you do, you might end up with very confusing results.

For an investor, investing in the longer term like 4-5 years time frame. You’ll have to ask yourself, did the company I invest in changed fundamentally over the last two weeks? What has really changed over the past few weeks? Is this an opportunity to scale into your favourite stock? (of course ensure that they are strong stocks, like a good cash flow, positive earnings, good economic moat.) An example would be TESLA. When tesla was trading at a high of $900, were you considering to invest in it? IF you did and  TESLA dropped to as low as around $550. Did you think of entering or were you scared? Fear often leads us to think illogically and act irrationally. Ask yourself what changed in TESLA over the past two weeks, did their vision change? Did something bad happen to the company? In such times, relying on your research and conviction is important.

For investing, we usually prefer to scale in in about 4 batches and not move in all at once. Nobody knows where the bottom will be and we can use technical analysis as one method to help us time a better entry.

Nasdaq Technicals 

We saw a nice rebound last Friday and probably a little overdue too. It came off the horizontal support of around 12233 and showed a nice bullish closing, closing above the 100ema. Will the market continue to rebound? The next important level to watch would be around that short term downtrend line which is around 12900. If it can sustain its footing around there we might see a more sustained rebound. If not the downside might continue which might take us down to the 150ema around 12100 then to 11800. A sustained rebound might take us to around 13300 to 13500.

This once again present opportunities for investors to scale in on good stocks like Apple, Amazon, Salesforce, Facebook, Meli and many more.

A consolidation at key support or resistance levels would be more ideal as this is like market storing power or resting before the next leg up.

As for traders, they are concerned with the volatility in the market and having a proper trading plan is important in such a market. If you fail to have a stop loss and keep picking up your contracts then that would not constitute a disciplined trader. Traders take advantage of the short term spikes in the market and are not overly concern if a company is overvalued, undervalued whereas an investor would pay more attention to these points.

So are you a trader or investor? Be clear of what you are so as to have a clearer results.

As for us, we are looking at this pullback to pick up some good stocks for our long term holdings (we’re talking about years ya) and looking to place some short term trades when market have found support.

Will update more in the coming days. Share with us if you’re a trader or investor.

Yours

Humbly

Kelwin&Roy


MercadoLibre Inc ( Meli) – Technical Levels We’re Looking At

3rd March, 2021, 9:52 PM

its MercadoLibre Inc ( Meli) – Technical Levels We’re Looking At

MercadoLibre 3rd March 2021

Chart source: Poemsview 3rd March 2021

MercadoLibre is the leading e-commerce technology and dominant retailer in Latin America. It holds a lead in its core market and the Company’s website allows businesses and individuals to list items and conduct sales and purchases online in either a fixed-price or auction format. MercadoLibre offers classified advertisements for motor vehicles, vessels, aircraft, real estate and services, and offers online payment services.

What surprising about (Meli)? Well, it isn’t e-commerce that gets most in-the-know investors excited about MercadoLibre’s future.  but rather its MercadoPago payment platform. Initially, the host of digital payments solutions was initially designed to support transactions on the MercadoLibre site, but it has since expanded to an off-platform payment platform and even into an asset management provider.

In the same quarter, MercadoPago saw its number of unique payers reach 60 million, with more than half using it for off-platform uses like buying goods at a local grocery store or gas station. Total payment volume (currency-neutral) exploded by 161% over the prior year’s quarter, with volume for off-platform leading the way with 197% growth.

Financial Results for Quarter ended December 31,2020

Some highlights :

  • Unique active users grew by 71.3% year-over-year, reaching 74.0 million.
  • Gross merchandise volume (“GMV”) grew to $6.6 billion, representing an increase of 69.6% in USD and 109.7% on an FX neutral basis.
  • Items sold reached 229.4 million, increasing by 109.5% year-over-year.
  • Online Payments TPV grew 142.9% year-over-year on an FX neutral basis and continued expanding its merchant base. The sequential deceleration was mostly explained by a higher impact on long tail sellers amidst the easing of COVID-19 restrictions.
  • Mobile Wallet delivered $3.3 billion in Total Payment Volume on a consolidated basis, leading to a 246.9% year-over-year growth on an FX neutral basis.

More can be read HERE!

Our Take

Meli has retraced close to 20% since the high of $2020 and is sitting around its 100ema of around $1600. For longer term investors, this level is one level to consider scaling in as it has reached a good support. $1600-1650 for a starter size might be a good start.

The next two level of support to consider scaling in might be around $1520 and the 150ema of around $1470. Get into your investment in phases and not all in at one time as nobody knows the bottom. MercadoLibre is a great company to diversify your portfolio and with the recent pullback a good opportunity might arise. The resistance is at the downtrend resistance which we have drawn. A break and stay above that might signal more upside and an end to the correction.

Yours

Humbly

Kelwin&Roy

Poems Oil CFD – [ How To Get Started!]

1st March, 2021, 6:50 PM

Poems Oil CFD – [ How To Get Started!]

Image source: axiory.com

Oil be it WTI or Brent has seen a gradual increase for the past year ever since it hit its historical zero! With more and more vaccines coming into play, economies are slowly recovering and sentiments are improving.

Always been wanting to trade oil but not sure how to?

Introducing our brand new commodities CFDs, UK Oil CFD & US Oil CFD! We are offering both Oil CFDs in 1USD and 100USD contracts which allows for greater flexibility!

UK Oil CFD (Brent) 

UK Oil CFD tracks the spot price of Brent Crude.Taking up roughly two-thirds of the world’s crude contracts, Brent Crude is the most widely used benchmark for oil. Brent Crude is produced near the sea and is light and sweet which makes it ideal for refining diesel fuel and gasoline.

US Oil CFD(WTI )

US Oil CFD tracks the spot price of West Texas Intermediate (WTI).

West Texas Intermediate (WTI) refers to oil that is extracted directly from the wells in the U.S. It is produced in landlocked areas which makes transportation difficult thus more expensive. WTI is the main benchmark for oil consumed in the United States.

What you might be missing out if you’re not trading oil! 

  1. Most valuable resource in the world. Crude oil is the primary source of energy in the world.It is black gold or the “blood” of world economies.  As much as 80% of a barrel of crude is refined into gasoline, jet fuel and distillate fuels such as diesel and heating oils. The rest is processed into petrochemical feedstocks, waxes, lubricating oils, asphalt and other by-products that make their way into thousands of everyday products such as vitamin capsules, tyres and plastics.

    Since the start of COVID-19, oil prices have plunged. Demand has shriveled because of pandemic lockdowns and travel restrictions. Of late, prices have partially rebounded. If you are wondering whether it is a good time to enter the oil market, read on as we explain why we think oil should be in every trader’s portfolio!

  2. High Liquidity .Crude has always been one of the most highly-traded commodities in terms of volume and open interest.
  3. Pent up Demand for oil. With the UK being the first country to approve the use of COVID-19 vaccines [2], the outlook for the global travel industry has started to look positive. As early as March 2021, pent-up demand for both domestic and global travel could be a powerful catalyst for refineries and airlines to restart oil hedging to lock in future prices. International travel is expected to pick up as borders gradually reopen. It is widely perceived that ‘peak oil’ [3] is not here yet. Pent-up travel demand from a widespread success of COVID-19 vaccinations may further increase crude-oil volatility. This makes it an even more compelling trading tool!
  4. Portfolio Diversification. It is wise to have a diversified portfolio and not put all your eggs in one basket.

If you’re interested in learning more or are keen to trade oil. Feel Free to drop us a message or you can open a trading account to get access to our Poems CFD.

Do ensure you understand the risk of trading CFDs and as usual, if you want to know more just drop us a message.

Yours

Humbly

Kelwin&Roy