STI- The Start Of A Correction?
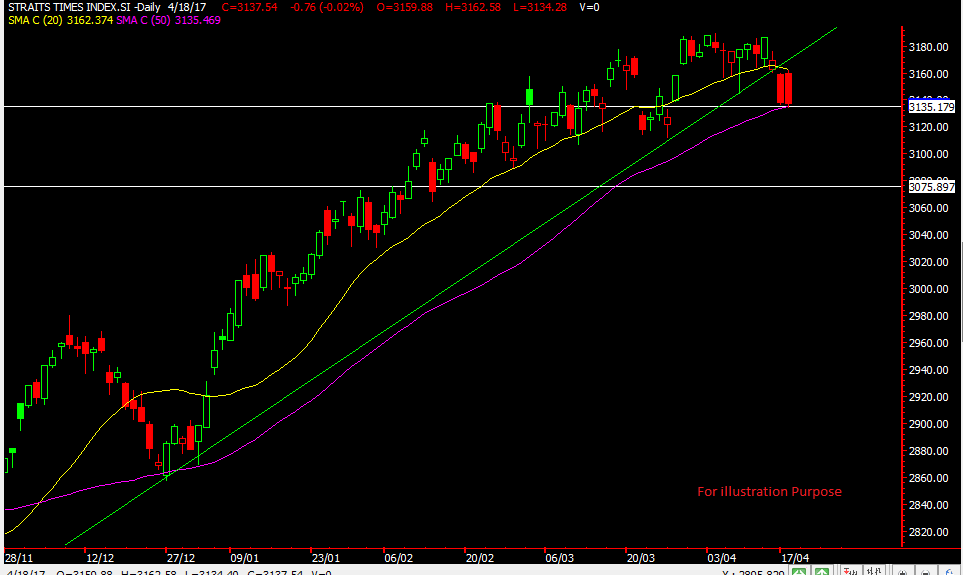
The Straits Time Index or STI for short has once again fallen below the 20days moving average. From our previous post on STI about a month back it broke the 20ma but managed to recover soon after. This time round things might look a little different.
From a technical perspective, the 20ma and 50ma looks like its getting closer (which is not a good sign) and the 20ma looks like its sloping down too. It is currently at around the 50ma and the horizontal support and if those break we might see if slowly fall towards 3070 area.
Geopolitical issues between North korea and US are taking headlines. But could there be more issues than that? We’re watching and ready for the next move to come. Goldman Sachs had an earning miss what would happen if more companies start to miss their earnings?
May is also round the corner and there is a saying sell and Go Away in May. Will that come true for this year? No one knows so let the chart tell us.
Our stop loss would be 3163 or 3190. Will update more when the time comes.
Yours
Humbly
Kelwin&Roy

[…] on 19th April when we posted regarding the Straits Times Index (STI) we were looking for a correction to start. […]