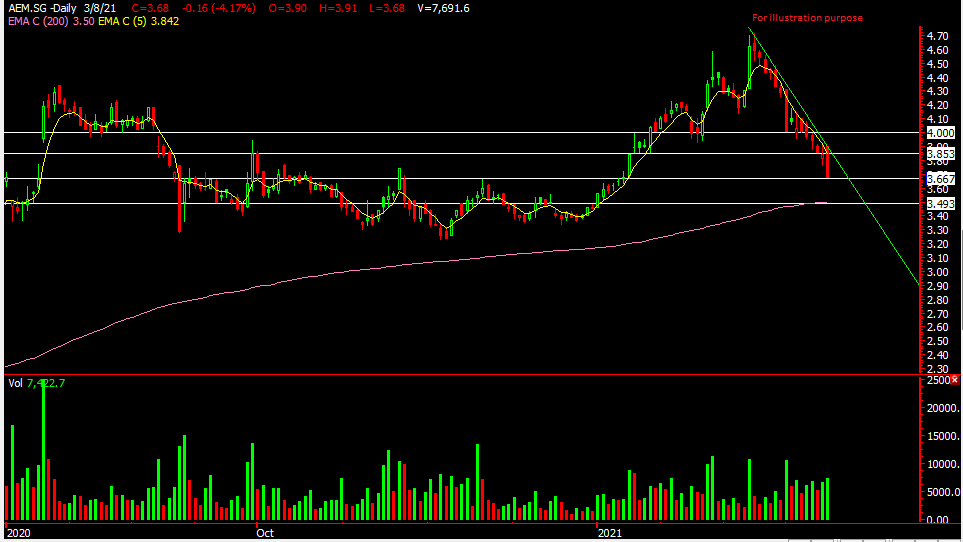
AEM – Is A Rebound Insight? When Will The Selling End? 
Chart Source: Poemsview 9th March 2021
AEM has recently been sold down over 20% when funds started to shift out to more value stocks. Despite research reports maintaining a buy on AEM, AEM continues to sell down causing investors to think twice about touching it.
Lets look a little closer at AEM and its recent results. Its FY20 revenue/net profit was in line with consensus. Balance sheet remains in a net cash position. It announced another acquisition to strengthen its system level test capabilities.
And now lets take a look at the technical chart. AEM has corrected about 20% sine the peak. A horizontal support of around $3.66 might provide some support and our next support might be around the 200ema of around $3.50. A rebound might be in sight after such a fall as bargain hunters are on the lookout at current price. A nimble bite at this current price is what some investors might consider doing. As for traders, we’re looking for a bullish candle off the support level or even a break above the 5ema (highlighted by the yellow line) before an entry. As we can see, the 5ema as been acting as the resistance and so far AEM cannot break through that.
What are your thoughts? Will AEM continue to fall even more? Lets us know!
Yours
Humbly
Kelwin&Roy
