UMS -[ All Time High, How Much Further Can It Possibly Go? ] 
Chart Source: Tradingview.com
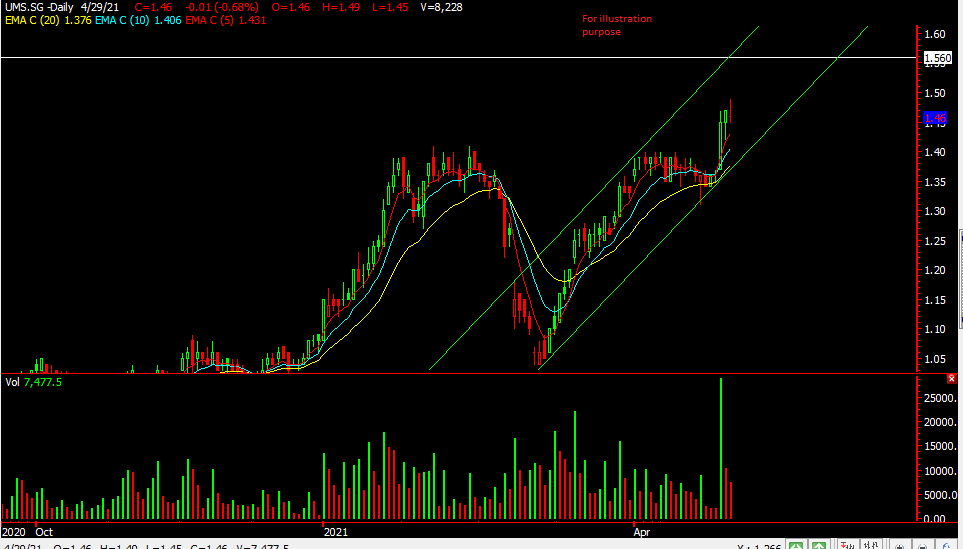
Chart Source: Poemsview 29th April 2021
UMS currently the market leader for the electronic sector broke above its resistance of $1.40 to make its all time high!
As it has made its all time high, one way to project its possible upwards movement could be using the fibo projection/extension or try drawing an uptrend parallel line. So from these drawings, we might see UMS moving up to $1.53-1.56 area and then maybe closer to $1.60. Profit taking might start coming in at those levels and like frencken after making all time high it might need to consolidate awhile before moving higher.
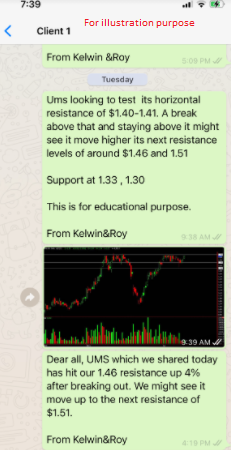
As UMS looked poised to breakout we alerted our clients of this potential break. We’re glad that UMS managed a nice breakout with volume hitting our first resistance point of $1.46. We’re patiently waiting for our second resistance point.
Want to be informed of such trade set up?
Be our client now and find out how much more value is waiting for you.
Yours
Humbly
Kelwin&Roy


